Chilean vs Immigrants from Australia Unemployment Among Ages 30 to 34 years
COMPARE
Chilean
Immigrants from Australia
Unemployment Among Ages 30 to 34 years
Unemployment Among Ages 30 to 34 years Comparison
Chileans
Immigrants from Australia
5.2%
UNEMPLOYMENT AMONG AGES 30 TO 34 YEARS
94.4/ 100
METRIC RATING
81st/ 347
METRIC RANK
5.2%
UNEMPLOYMENT AMONG AGES 30 TO 34 YEARS
93.5/ 100
METRIC RATING
86th/ 347
METRIC RANK
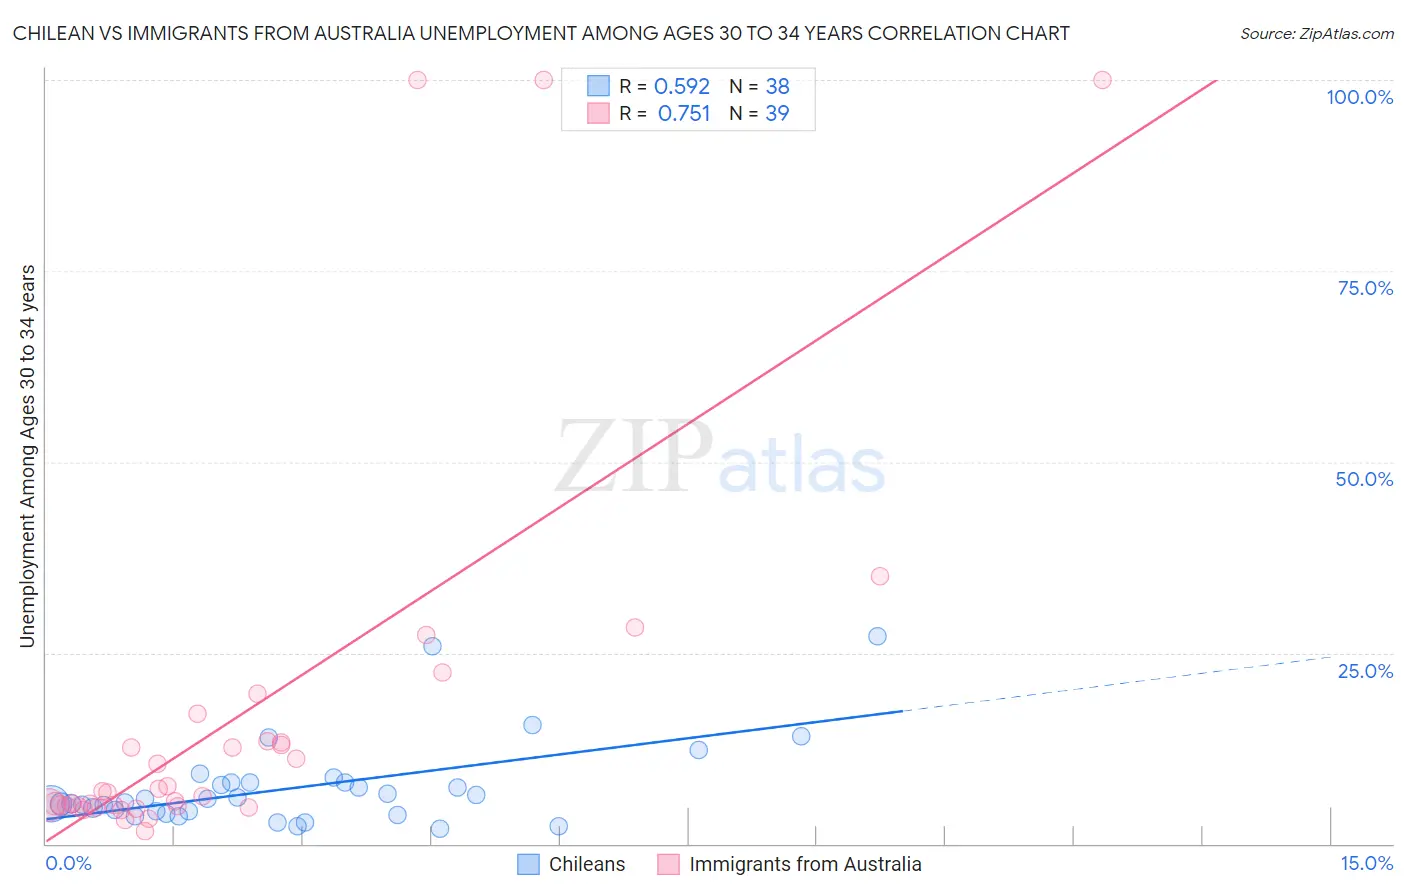
Chilean vs Immigrants from Australia Unemployment Among Ages 30 to 34 years Correlation Chart
The statistical analysis conducted on geographies consisting of 248,544,127 people shows a substantial positive correlation between the proportion of Chileans and unemployment rate among population between the ages 30 and 34 in the United States with a correlation coefficient (R) of 0.592 and weighted average of 5.2%. Similarly, the statistical analysis conducted on geographies consisting of 218,832,474 people shows a strong positive correlation between the proportion of Immigrants from Australia and unemployment rate among population between the ages 30 and 34 in the United States with a correlation coefficient (R) of 0.751 and weighted average of 5.2%, a difference of 0.30%.
Unemployment Among Ages 30 to 34 years Correlation Summary
| Measurement | Chilean | Immigrants from Australia |
| Minimum | 2.0% | 1.7% |
| Maximum | 27.1% | 100.0% |
| Range | 25.1% | 98.3% |
| Mean | 7.4% | 16.7% |
| Median | 5.6% | 6.6% |
| Interquartile 25% (IQ1) | 4.2% | 4.9% |
| Interquartile 75% (IQ3) | 8.0% | 13.4% |
| Interquartile Range (IQR) | 3.8% | 8.5% |
| Standard Deviation (Sample) | 5.6% | 25.5% |
| Standard Deviation (Population) | 5.5% | 25.2% |
Demographics Similar to Chileans and Immigrants from Australia by Unemployment Among Ages 30 to 34 years
In terms of unemployment among ages 30 to 34 years, the demographic groups most similar to Chileans are Immigrants from Latvia (5.2%, a difference of 0.070%), Immigrants from Indonesia (5.2%, a difference of 0.10%), Immigrants from Korea (5.2%, a difference of 0.11%), Immigrants from Uganda (5.2%, a difference of 0.16%), and Immigrants from Egypt (5.2%, a difference of 0.18%). Similarly, the demographic groups most similar to Immigrants from Australia are Bhutanese (5.2%, a difference of 0.010%), Immigrants from Kenya (5.2%, a difference of 0.040%), Immigrants from Sweden (5.2%, a difference of 0.050%), Immigrants from Egypt (5.2%, a difference of 0.11%), and Immigrants from Uganda (5.2%, a difference of 0.14%).
| Demographics | Rating | Rank | Unemployment Among Ages 30 to 34 years |
| Slovenes | 96.2 /100 | #73 | Exceptional 5.2% |
| Immigrants | Asia | 96.2 /100 | #74 | Exceptional 5.2% |
| Iranians | 96.0 /100 | #75 | Exceptional 5.2% |
| Scandinavians | 95.6 /100 | #76 | Exceptional 5.2% |
| Uruguayans | 95.4 /100 | #77 | Exceptional 5.2% |
| Indonesians | 95.1 /100 | #78 | Exceptional 5.2% |
| Immigrants | Lithuania | 95.0 /100 | #79 | Exceptional 5.2% |
| Immigrants | Indonesia | 94.7 /100 | #80 | Exceptional 5.2% |
| Chileans | 94.4 /100 | #81 | Exceptional 5.2% |
| Immigrants | Latvia | 94.2 /100 | #82 | Exceptional 5.2% |
| Immigrants | Korea | 94.1 /100 | #83 | Exceptional 5.2% |
| Immigrants | Uganda | 94.0 /100 | #84 | Exceptional 5.2% |
| Immigrants | Egypt | 93.9 /100 | #85 | Exceptional 5.2% |
| Immigrants | Australia | 93.5 /100 | #86 | Exceptional 5.2% |
| Bhutanese | 93.5 /100 | #87 | Exceptional 5.2% |
| Immigrants | Kenya | 93.3 /100 | #88 | Exceptional 5.2% |
| Immigrants | Sweden | 93.3 /100 | #89 | Exceptional 5.2% |
| Immigrants | Romania | 92.8 /100 | #90 | Exceptional 5.2% |
| Iraqis | 92.6 /100 | #91 | Exceptional 5.2% |
| Immigrants | Argentina | 92.5 /100 | #92 | Exceptional 5.2% |
| Laotians | 92.4 /100 | #93 | Exceptional 5.2% |