Chickasaw vs Immigrants from Central America Unemployment Among Ages 45 to 54 years
COMPARE
Chickasaw
Immigrants from Central America
Unemployment Among Ages 45 to 54 years
Unemployment Among Ages 45 to 54 years Comparison
Chickasaw
Immigrants from Central America
4.2%
UNEMPLOYMENT AMONG AGES 45 TO 54 YEARS
99.5/ 100
METRIC RATING
54th/ 347
METRIC RANK
5.0%
UNEMPLOYMENT AMONG AGES 45 TO 54 YEARS
0.0/ 100
METRIC RATING
272nd/ 347
METRIC RANK
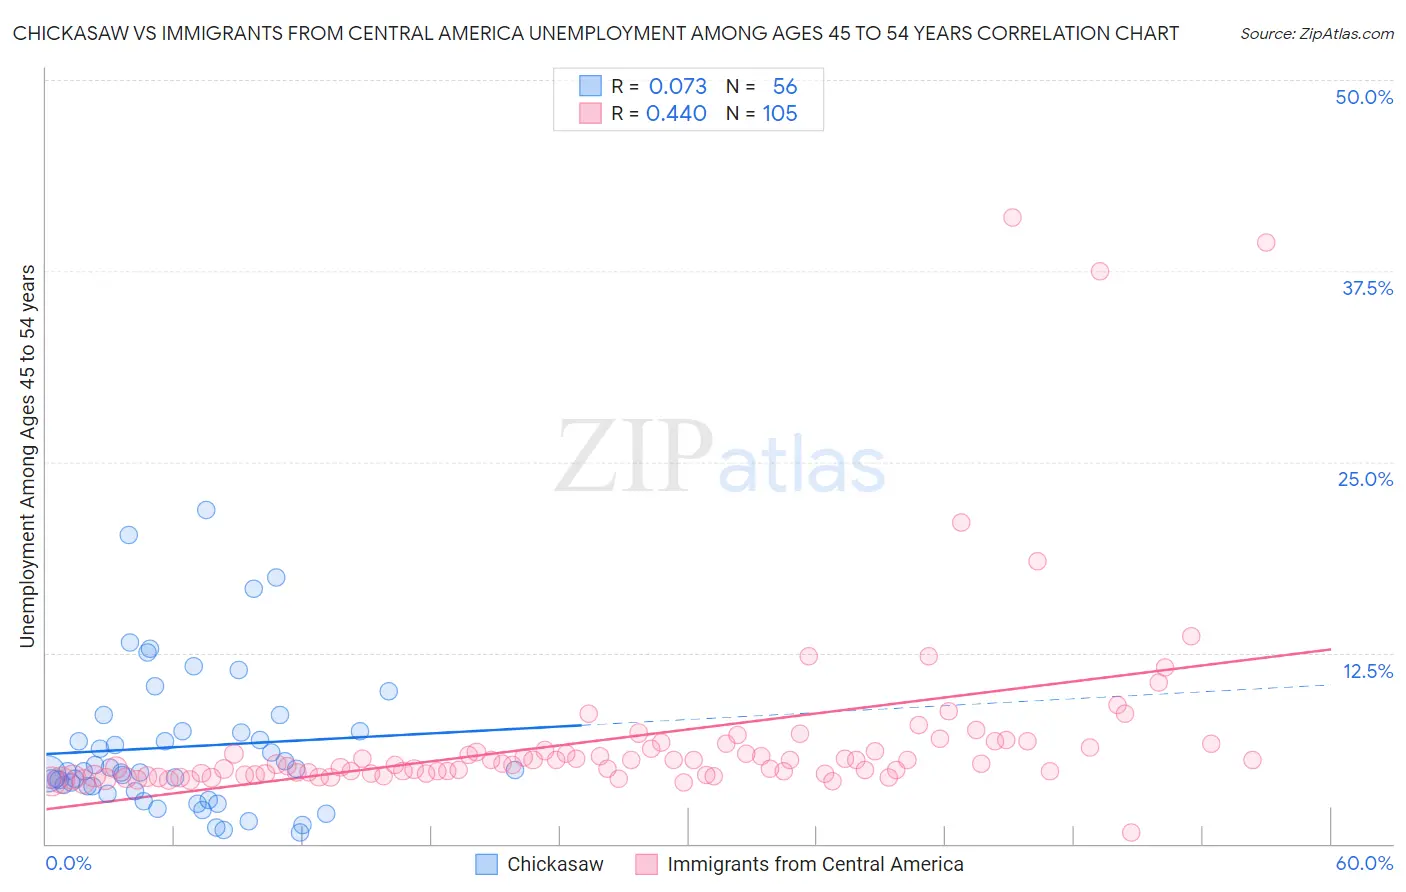
Chickasaw vs Immigrants from Central America Unemployment Among Ages 45 to 54 years Correlation Chart
The statistical analysis conducted on geographies consisting of 145,306,851 people shows a slight positive correlation between the proportion of Chickasaw and unemployment rate among population between the ages 45 and 54 in the United States with a correlation coefficient (R) of 0.073 and weighted average of 4.2%. Similarly, the statistical analysis conducted on geographies consisting of 505,939,152 people shows a moderate positive correlation between the proportion of Immigrants from Central America and unemployment rate among population between the ages 45 and 54 in the United States with a correlation coefficient (R) of 0.440 and weighted average of 5.0%, a difference of 17.2%.
Unemployment Among Ages 45 to 54 years Correlation Summary
| Measurement | Chickasaw | Immigrants from Central America |
| Minimum | 0.70% | 0.70% |
| Maximum | 21.9% | 41.0% |
| Range | 21.2% | 40.3% |
| Mean | 6.3% | 6.9% |
| Median | 4.8% | 5.2% |
| Interquartile 25% (IQ1) | 3.6% | 4.5% |
| Interquartile 75% (IQ3) | 7.4% | 6.4% |
| Interquartile Range (IQR) | 3.8% | 1.9% |
| Standard Deviation (Sample) | 4.7% | 6.2% |
| Standard Deviation (Population) | 4.7% | 6.2% |
Similar Demographics by Unemployment Among Ages 45 to 54 years
Demographics Similar to Chickasaw by Unemployment Among Ages 45 to 54 years
In terms of unemployment among ages 45 to 54 years, the demographic groups most similar to Chickasaw are Irish (4.2%, a difference of 0.0%), Polish (4.2%, a difference of 0.050%), Latvian (4.2%, a difference of 0.12%), Immigrants from Jordan (4.3%, a difference of 0.28%), and Burmese (4.2%, a difference of 0.31%).
| Demographics | Rating | Rank | Unemployment Among Ages 45 to 54 years |
| Filipinos | 99.6 /100 | #47 | Exceptional 4.2% |
| Finns | 99.6 /100 | #48 | Exceptional 4.2% |
| Immigrants | Zimbabwe | 99.6 /100 | #49 | Exceptional 4.2% |
| Basques | 99.6 /100 | #50 | Exceptional 4.2% |
| Burmese | 99.6 /100 | #51 | Exceptional 4.2% |
| Poles | 99.5 /100 | #52 | Exceptional 4.2% |
| Irish | 99.5 /100 | #53 | Exceptional 4.2% |
| Chickasaw | 99.5 /100 | #54 | Exceptional 4.2% |
| Latvians | 99.4 /100 | #55 | Exceptional 4.2% |
| Immigrants | Jordan | 99.3 /100 | #56 | Exceptional 4.3% |
| Immigrants | Sri Lanka | 99.3 /100 | #57 | Exceptional 4.3% |
| Greeks | 99.3 /100 | #58 | Exceptional 4.3% |
| Okinawans | 99.2 /100 | #59 | Exceptional 4.3% |
| Immigrants | Korea | 99.2 /100 | #60 | Exceptional 4.3% |
| Immigrants | Pakistan | 99.2 /100 | #61 | Exceptional 4.3% |
Demographics Similar to Immigrants from Central America by Unemployment Among Ages 45 to 54 years
In terms of unemployment among ages 45 to 54 years, the demographic groups most similar to Immigrants from Central America are Immigrants from Latin America (5.0%, a difference of 0.16%), Cajun (5.0%, a difference of 0.17%), U.S. Virgin Islander (5.0%, a difference of 0.22%), Immigrants from Ghana (5.0%, a difference of 0.25%), and Bermudan (5.0%, a difference of 0.27%).
| Demographics | Rating | Rank | Unemployment Among Ages 45 to 54 years |
| Immigrants | Somalia | 0.1 /100 | #265 | Tragic 4.9% |
| Ghanaians | 0.0 /100 | #266 | Tragic 4.9% |
| Bahamians | 0.0 /100 | #267 | Tragic 4.9% |
| Immigrants | Uzbekistan | 0.0 /100 | #268 | Tragic 4.9% |
| Somalis | 0.0 /100 | #269 | Tragic 5.0% |
| Immigrants | Ghana | 0.0 /100 | #270 | Tragic 5.0% |
| Cajuns | 0.0 /100 | #271 | Tragic 5.0% |
| Immigrants | Central America | 0.0 /100 | #272 | Tragic 5.0% |
| Immigrants | Latin America | 0.0 /100 | #273 | Tragic 5.0% |
| U.S. Virgin Islanders | 0.0 /100 | #274 | Tragic 5.0% |
| Bermudans | 0.0 /100 | #275 | Tragic 5.0% |
| French American Indians | 0.0 /100 | #276 | Tragic 5.0% |
| Immigrants | Mexico | 0.0 /100 | #277 | Tragic 5.0% |
| Dutch West Indians | 0.0 /100 | #278 | Tragic 5.0% |
| Nepalese | 0.0 /100 | #279 | Tragic 5.0% |