Chickasaw vs Afghan Unemployment Among Ages 65 to 74 years
COMPARE
Chickasaw
Afghan
Unemployment Among Ages 65 to 74 years
Unemployment Among Ages 65 to 74 years Comparison
Chickasaw
Afghans
4.7%
UNEMPLOYMENT AMONG AGES 65 TO 74 YEARS
100.0/ 100
METRIC RATING
9th/ 347
METRIC RANK
5.2%
UNEMPLOYMENT AMONG AGES 65 TO 74 YEARS
99.0/ 100
METRIC RATING
74th/ 347
METRIC RANK
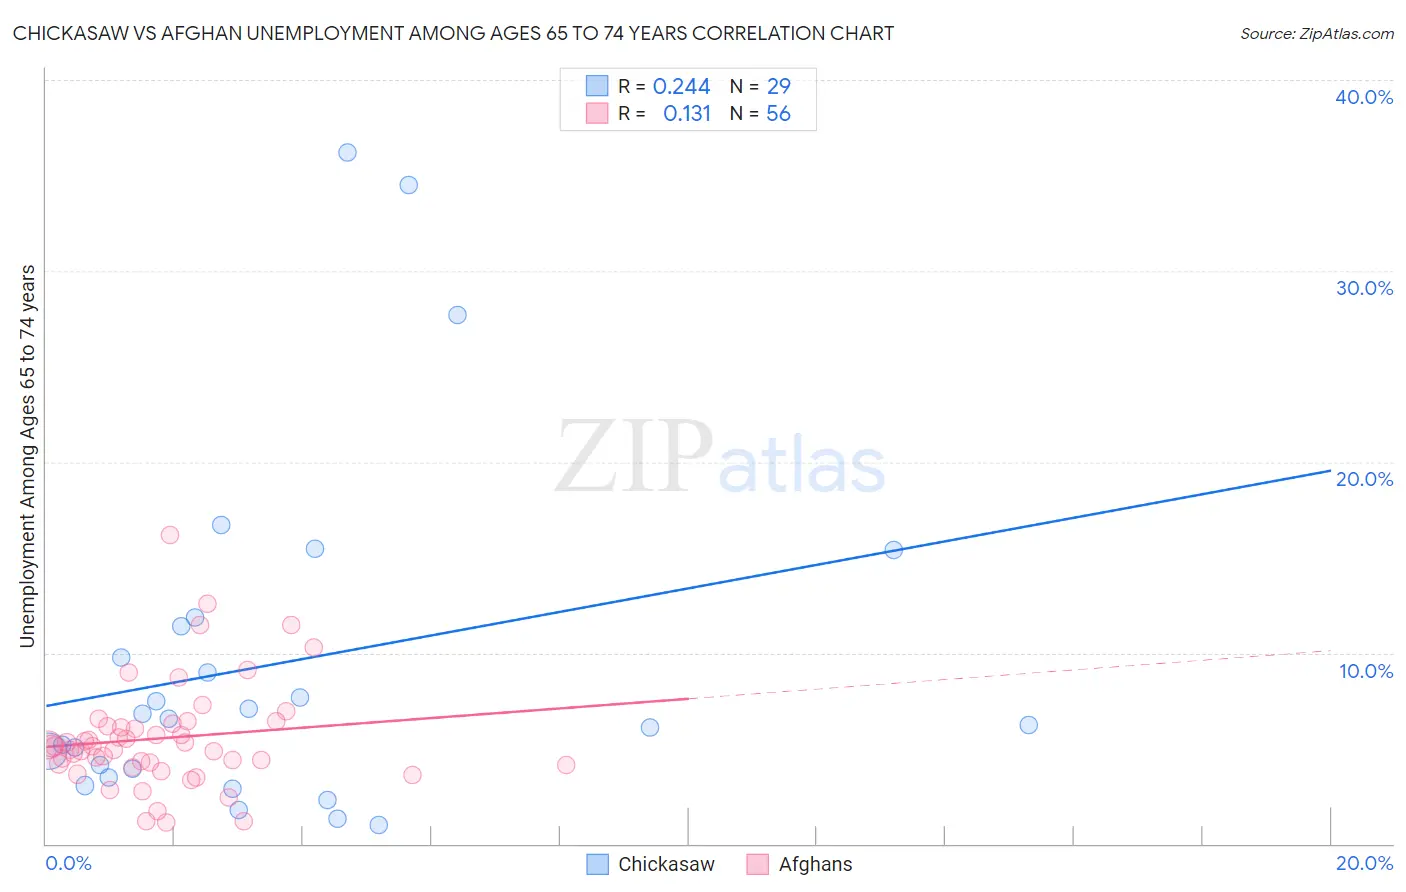
Chickasaw vs Afghan Unemployment Among Ages 65 to 74 years Correlation Chart
The statistical analysis conducted on geographies consisting of 136,812,598 people shows a weak positive correlation between the proportion of Chickasaw and unemployment rate among population between the ages 65 and 74 in the United States with a correlation coefficient (R) of 0.244 and weighted average of 4.7%. Similarly, the statistical analysis conducted on geographies consisting of 142,180,614 people shows a poor positive correlation between the proportion of Afghans and unemployment rate among population between the ages 65 and 74 in the United States with a correlation coefficient (R) of 0.131 and weighted average of 5.2%, a difference of 9.5%.
Unemployment Among Ages 65 to 74 years Correlation Summary
| Measurement | Chickasaw | Afghan |
| Minimum | 0.98% | 1.1% |
| Maximum | 36.2% | 16.2% |
| Range | 35.2% | 15.1% |
| Mean | 9.5% | 5.5% |
| Median | 6.6% | 5.1% |
| Interquartile 25% (IQ1) | 3.7% | 4.2% |
| Interquartile 75% (IQ3) | 11.6% | 6.2% |
| Interquartile Range (IQR) | 7.9% | 2.1% |
| Standard Deviation (Sample) | 9.1% | 2.8% |
| Standard Deviation (Population) | 9.0% | 2.8% |
Similar Demographics by Unemployment Among Ages 65 to 74 years
Demographics Similar to Chickasaw by Unemployment Among Ages 65 to 74 years
In terms of unemployment among ages 65 to 74 years, the demographic groups most similar to Chickasaw are Osage (4.7%, a difference of 0.11%), Comanche (4.7%, a difference of 0.26%), Indonesian (4.7%, a difference of 0.43%), Immigrants from Congo (4.7%, a difference of 0.52%), and Tongan (4.7%, a difference of 0.68%).
| Demographics | Rating | Rank | Unemployment Among Ages 65 to 74 years |
| Chinese | 100.0 /100 | #2 | Exceptional 4.4% |
| Fijians | 100.0 /100 | #3 | Exceptional 4.5% |
| Tsimshian | 100.0 /100 | #4 | Exceptional 4.6% |
| Sudanese | 100.0 /100 | #5 | Exceptional 4.6% |
| Immigrants | Cuba | 100.0 /100 | #6 | Exceptional 4.6% |
| Indonesians | 100.0 /100 | #7 | Exceptional 4.7% |
| Comanche | 100.0 /100 | #8 | Exceptional 4.7% |
| Chickasaw | 100.0 /100 | #9 | Exceptional 4.7% |
| Osage | 100.0 /100 | #10 | Exceptional 4.7% |
| Immigrants | Congo | 100.0 /100 | #11 | Exceptional 4.7% |
| Tongans | 100.0 /100 | #12 | Exceptional 4.7% |
| Lumbee | 100.0 /100 | #13 | Exceptional 4.8% |
| Cubans | 100.0 /100 | #14 | Exceptional 4.8% |
| Immigrants | North Macedonia | 100.0 /100 | #15 | Exceptional 4.8% |
| Immigrants | Burma/Myanmar | 100.0 /100 | #16 | Exceptional 4.8% |
Demographics Similar to Afghans by Unemployment Among Ages 65 to 74 years
In terms of unemployment among ages 65 to 74 years, the demographic groups most similar to Afghans are Filipino (5.2%, a difference of 0.0%), Okinawan (5.2%, a difference of 0.010%), Estonian (5.2%, a difference of 0.010%), Immigrants from Oceania (5.2%, a difference of 0.020%), and Immigrants from Sudan (5.2%, a difference of 0.020%).
| Demographics | Rating | Rank | Unemployment Among Ages 65 to 74 years |
| Swiss | 99.2 /100 | #67 | Exceptional 5.1% |
| Latvians | 99.2 /100 | #68 | Exceptional 5.1% |
| Scandinavians | 99.1 /100 | #69 | Exceptional 5.2% |
| Immigrants | Japan | 99.1 /100 | #70 | Exceptional 5.2% |
| Scotch-Irish | 99.0 /100 | #71 | Exceptional 5.2% |
| Immigrants | Oceania | 99.0 /100 | #72 | Exceptional 5.2% |
| Filipinos | 99.0 /100 | #73 | Exceptional 5.2% |
| Afghans | 99.0 /100 | #74 | Exceptional 5.2% |
| Okinawans | 99.0 /100 | #75 | Exceptional 5.2% |
| Estonians | 99.0 /100 | #76 | Exceptional 5.2% |
| Immigrants | Sudan | 98.9 /100 | #77 | Exceptional 5.2% |
| Northern Europeans | 98.9 /100 | #78 | Exceptional 5.2% |
| Slavs | 98.7 /100 | #79 | Exceptional 5.2% |
| Immigrants | South Africa | 98.6 /100 | #80 | Exceptional 5.2% |
| Immigrants | Scotland | 98.6 /100 | #81 | Exceptional 5.2% |