Cheyenne vs Dominican Unemployment Among Ages 16 to 19 years
COMPARE
Cheyenne
Dominican
Unemployment Among Ages 16 to 19 years
Unemployment Among Ages 16 to 19 years Comparison
Cheyenne
Dominicans
22.3%
UNEMPLOYMENT AMONG AGES 16 TO 19 YEARS
0.0/ 100
METRIC RATING
320th/ 347
METRIC RANK
23.6%
UNEMPLOYMENT AMONG AGES 16 TO 19 YEARS
0.0/ 100
METRIC RATING
330th/ 347
METRIC RANK
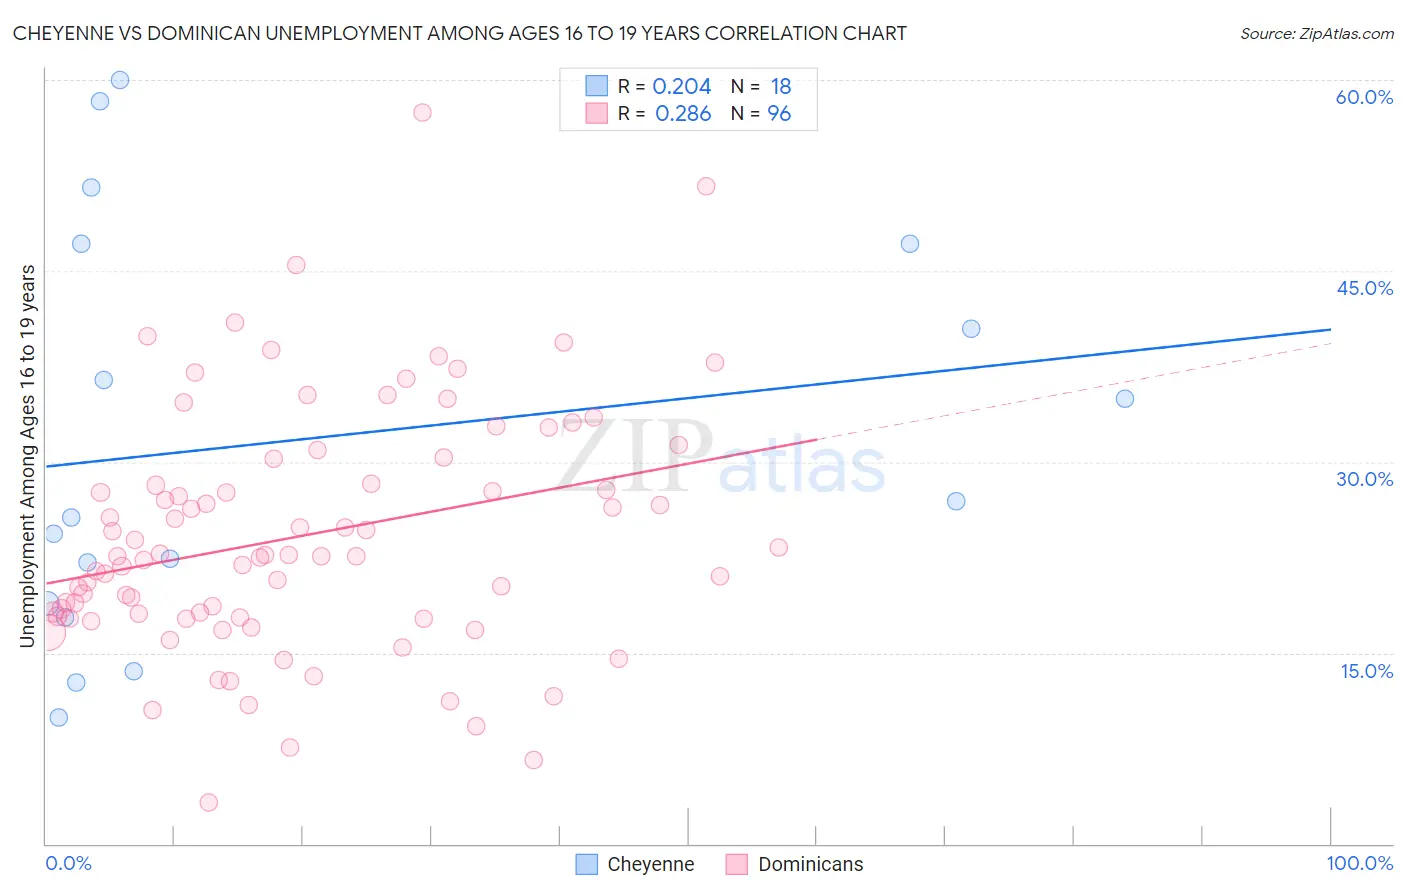
Cheyenne vs Dominican Unemployment Among Ages 16 to 19 years Correlation Chart
The statistical analysis conducted on geographies consisting of 79,316,787 people shows a weak positive correlation between the proportion of Cheyenne and unemployment rate among population between the ages 16 and 19 in the United States with a correlation coefficient (R) of 0.204 and weighted average of 22.3%. Similarly, the statistical analysis conducted on geographies consisting of 338,410,900 people shows a weak positive correlation between the proportion of Dominicans and unemployment rate among population between the ages 16 and 19 in the United States with a correlation coefficient (R) of 0.286 and weighted average of 23.6%, a difference of 6.2%.
Unemployment Among Ages 16 to 19 years Correlation Summary
| Measurement | Cheyenne | Dominican |
| Minimum | 9.9% | 3.2% |
| Maximum | 60.0% | 57.4% |
| Range | 50.1% | 54.2% |
| Mean | 31.7% | 24.2% |
| Median | 26.3% | 22.6% |
| Interquartile 25% (IQ1) | 18.9% | 17.8% |
| Interquartile 75% (IQ3) | 47.1% | 29.3% |
| Interquartile Range (IQR) | 28.2% | 11.4% |
| Standard Deviation (Sample) | 15.9% | 9.6% |
| Standard Deviation (Population) | 15.5% | 9.6% |
Demographics Similar to Cheyenne and Dominicans by Unemployment Among Ages 16 to 19 years
In terms of unemployment among ages 16 to 19 years, the demographic groups most similar to Cheyenne are Immigrants from West Indies (22.2%, a difference of 0.23%), Immigrants from Jamaica (22.2%, a difference of 0.39%), Immigrants from Belize (22.2%, a difference of 0.54%), West Indian (22.4%, a difference of 0.70%), and Barbadian (22.5%, a difference of 0.83%). Similarly, the demographic groups most similar to Dominicans are Tlingit-Haida (23.5%, a difference of 0.44%), British West Indian (24.0%, a difference of 1.4%), Immigrants from Dominican Republic (23.3%, a difference of 1.5%), Immigrants from Barbados (24.0%, a difference of 1.6%), and Pima (23.1%, a difference of 2.2%).
| Demographics | Rating | Rank | Unemployment Among Ages 16 to 19 years |
| Immigrants | Dominica | 0.0 /100 | #315 | Tragic 21.9% |
| Tohono O'odham | 0.0 /100 | #316 | Tragic 22.1% |
| Immigrants | Belize | 0.0 /100 | #317 | Tragic 22.2% |
| Immigrants | Jamaica | 0.0 /100 | #318 | Tragic 22.2% |
| Immigrants | West Indies | 0.0 /100 | #319 | Tragic 22.2% |
| Cheyenne | 0.0 /100 | #320 | Tragic 22.3% |
| West Indians | 0.0 /100 | #321 | Tragic 22.4% |
| Barbadians | 0.0 /100 | #322 | Tragic 22.5% |
| Yakama | 0.0 /100 | #323 | Tragic 22.5% |
| Immigrants | Armenia | 0.0 /100 | #324 | Tragic 22.6% |
| Trinidadians and Tobagonians | 0.0 /100 | #325 | Tragic 22.6% |
| Immigrants | Trinidad and Tobago | 0.0 /100 | #326 | Tragic 23.1% |
| Pima | 0.0 /100 | #327 | Tragic 23.1% |
| Immigrants | Dominican Republic | 0.0 /100 | #328 | Tragic 23.3% |
| Tlingit-Haida | 0.0 /100 | #329 | Tragic 23.5% |
| Dominicans | 0.0 /100 | #330 | Tragic 23.6% |
| British West Indians | 0.0 /100 | #331 | Tragic 24.0% |
| Immigrants | Barbados | 0.0 /100 | #332 | Tragic 24.0% |
| Paiute | 0.0 /100 | #333 | Tragic 24.4% |
| Guyanese | 0.0 /100 | #334 | Tragic 24.8% |
| Arapaho | 0.0 /100 | #335 | Tragic 25.2% |