Central American vs Immigrants from Albania Male Unemployment
COMPARE
Central American
Immigrants from Albania
Male Unemployment
Male Unemployment Comparison
Central Americans
Immigrants from Albania
5.6%
MALE UNEMPLOYMENT
1.8/ 100
METRIC RATING
229th/ 347
METRIC RANK
5.5%
MALE UNEMPLOYMENT
3.6/ 100
METRIC RATING
218th/ 347
METRIC RANK
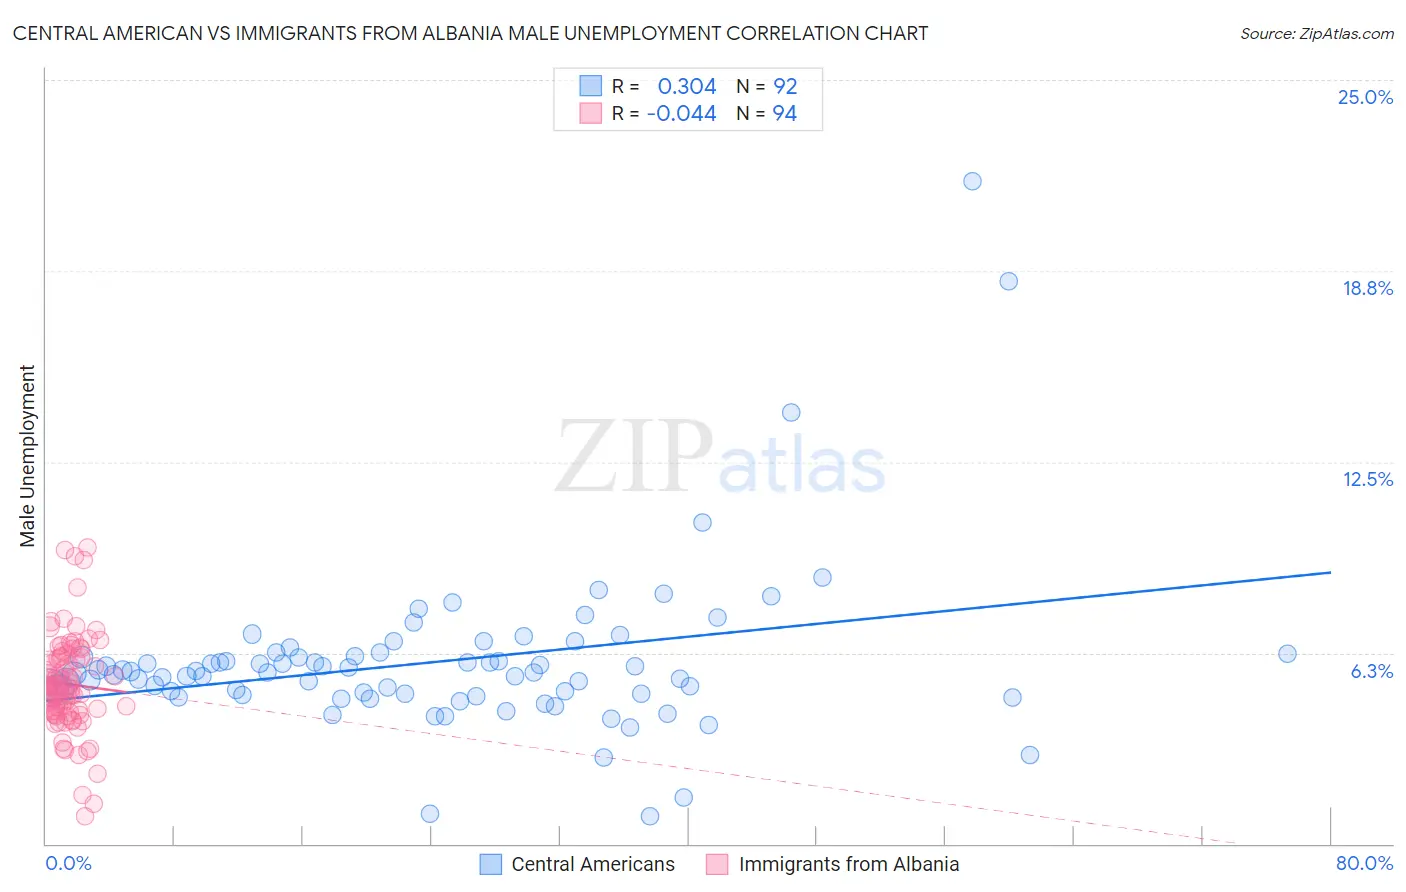
Central American vs Immigrants from Albania Male Unemployment Correlation Chart
The statistical analysis conducted on geographies consisting of 500,623,781 people shows a mild positive correlation between the proportion of Central Americans and unemployment rate among males in the United States with a correlation coefficient (R) of 0.304 and weighted average of 5.6%. Similarly, the statistical analysis conducted on geographies consisting of 119,319,366 people shows no correlation between the proportion of Immigrants from Albania and unemployment rate among males in the United States with a correlation coefficient (R) of -0.044 and weighted average of 5.5%, a difference of 1.0%.
Male Unemployment Correlation Summary
| Measurement | Central American | Immigrants from Albania |
| Minimum | 0.90% | 0.90% |
| Maximum | 21.7% | 9.7% |
| Range | 20.8% | 8.8% |
| Mean | 5.9% | 5.2% |
| Median | 5.6% | 5.1% |
| Interquartile 25% (IQ1) | 4.9% | 4.3% |
| Interquartile 75% (IQ3) | 6.2% | 6.1% |
| Interquartile Range (IQR) | 1.3% | 1.8% |
| Standard Deviation (Sample) | 2.7% | 1.6% |
| Standard Deviation (Population) | 2.7% | 1.6% |
Demographics Similar to Central Americans and Immigrants from Albania by Male Unemployment
In terms of male unemployment, the demographic groups most similar to Central Americans are Seminole (5.6%, a difference of 0.0%), Immigrants from Panama (5.6%, a difference of 0.020%), Immigrants from Cambodia (5.6%, a difference of 0.030%), Immigrants from Africa (5.6%, a difference of 0.040%), and Choctaw (5.6%, a difference of 0.090%). Similarly, the demographic groups most similar to Immigrants from Albania are Immigrants from Western Asia (5.6%, a difference of 0.050%), Portuguese (5.6%, a difference of 0.070%), Soviet Union (5.6%, a difference of 0.18%), Delaware (5.5%, a difference of 0.21%), and Immigrants (5.5%, a difference of 0.26%).
| Demographics | Rating | Rank | Male Unemployment |
| Ugandans | 6.3 /100 | #213 | Tragic 5.5% |
| Puget Sound Salish | 5.6 /100 | #214 | Tragic 5.5% |
| Samoans | 4.9 /100 | #215 | Tragic 5.5% |
| Immigrants | Immigrants | 4.3 /100 | #216 | Tragic 5.5% |
| Delaware | 4.2 /100 | #217 | Tragic 5.5% |
| Immigrants | Albania | 3.6 /100 | #218 | Tragic 5.5% |
| Immigrants | Western Asia | 3.5 /100 | #219 | Tragic 5.6% |
| Portuguese | 3.5 /100 | #220 | Tragic 5.6% |
| Soviet Union | 3.2 /100 | #221 | Tragic 5.6% |
| Immigrants | Micronesia | 2.9 /100 | #222 | Tragic 5.6% |
| Creek | 2.6 /100 | #223 | Tragic 5.6% |
| Cherokee | 2.4 /100 | #224 | Tragic 5.6% |
| Panamanians | 1.9 /100 | #225 | Tragic 5.6% |
| Immigrants | Cambodia | 1.8 /100 | #226 | Tragic 5.6% |
| Immigrants | Panama | 1.8 /100 | #227 | Tragic 5.6% |
| Seminole | 1.8 /100 | #228 | Tragic 5.6% |
| Central Americans | 1.8 /100 | #229 | Tragic 5.6% |
| Immigrants | Africa | 1.7 /100 | #230 | Tragic 5.6% |
| Choctaw | 1.6 /100 | #231 | Tragic 5.6% |
| Moroccans | 1.6 /100 | #232 | Tragic 5.6% |
| Somalis | 1.5 /100 | #233 | Tragic 5.6% |