Carpatho Rusyn vs Immigrants from Peru Unemployment Among Ages 65 to 74 years

COMPARE

Carpatho Rusyn
Race
Ancestry
AfghanAfricanAlaska NativeAlaskan AthabascanAlbanianAleutAlsatianAmericanApacheArabArapahoArgentineanArmenianAssyrian/Chaldean/SyriacAustralianAustrianBahamianBangladeshiBarbadianBasqueBelgianBelizeanBermudanBhutaneseBlackfeetBolivianBrazilianBritishBritish West IndianBulgarianBurmeseCajunCambodianCanadianCape VerdeanCarpatho RusynCelticCentral AmericanCentral American IndianCherokeeCheyenneChickasawChileanChineseChippewaChoctawColombianColvilleComancheCosta RicanCreeCreekCroatianCrowCubanCypriotCzechCzechoslovakianDanishDelawareDominicanDutchDutch West IndianEastern EuropeanEcuadorianEgyptianEnglishEstonianEthiopianEuropeanFijianFilipinoFinnishFrenchFrench American IndianFrench CanadianGermanGerman RussianGhanaianGreekGuamanian/ChamorroGuatemalanGuyaneseHaitianHmongHonduranHopiHoumaHungarianIcelanderIndian (Asian)IndonesianInupiatIranianIraqiIrishIroquoisIsraeliItalianJamaicanJapaneseJordanianKenyanKiowaKoreanLaotianLatvianLebaneseLiberianLithuanianLumbeeLuxembourgerMacedonianMalaysianMalteseMarshalleseMenomineeMexicanMexican American IndianMongolianMoroccanNative HawaiianNavajoNepaleseNew ZealanderNicaraguanNigerianNorthern EuropeanNorwegianOkinawanOsageOttawaPaiutePakistaniPalestinianPanamanianParaguayanPennsylvania GermanPeruvianPimaPolishPortuguesePotawatomiPuebloPuerto RicanPuget Sound SalishRomanianRussianSalvadoranSamoanScandinavianScotch-IrishScottishSeminoleSenegaleseSerbianShoshoneSierra LeoneanSiouxSlavicSlovakSloveneSomaliSouth AfricanSouth AmericanSouth American IndianSoviet UnionSpaniardSpanishSpanish AmericanSpanish American IndianSri LankanSubsaharan AfricanSudaneseSwedishSwissSyrianTaiwaneseThaiTlingit-HaidaTohono O'OdhamTonganTrinidadian and TobagonianTsimshianTurkishU.S. Virgin IslanderUgandanUkrainianUruguayanUteVenezuelanVietnameseWelshWest IndianYakamaYaquiYugoslavianYumanYup'ikZimbabwean
Immigration
NonimmigrantsImmigrantsAfghanistanAfricaAlbaniaArgentinaArmeniaAsiaAustraliaAustriaBahamasBangladeshBarbadosBelarusBelgiumBelizeBoliviaBosnia and HerzegovinaBrazilBulgariaBurma/MyanmarCabo VerdeCambodiaCameroonCanadaCaribbeanCentral AmericaChileChinaColombiaCongoCosta RicaCroatiaCubaCzechoslovakiaDenmarkDominicaDominican RepublicEastern AfricaEastern AsiaEastern EuropeEcuadorEgyptEl SalvadorEnglandEritreaEthiopiaEuropeFijiFranceGermanyGhanaGreeceGrenadaGuatemalaGuyanaHaitiHondurasHong KongHungaryIndiaIndonesiaIranIraqIrelandIsraelItalyJamaicaJapanJordanKazakhstanKenyaKoreaKuwaitLaosLatin AmericaLatviaLebanonLiberiaLithuaniaMalaysiaMexicoMicronesiaMiddle AfricaMoldovaMoroccoNepalNetherlandsNicaraguaNigeriaNorth AmericaNorth MacedoniaNorthern AfricaNorthern EuropeNorwayOceaniaPakistanPanamaPhilippinesPolandPortugalRomaniaRussiaSaudi ArabiaScotlandSenegalSerbiaSierra LeoneSingaporeSomaliaSouth AfricaSouth AmericaSouth Central AsiaSouth Eastern AsiaSouthern EuropeSpainSri LankaSt. Vincent and the GrenadinesSudanSwedenSwitzerlandSyriaTaiwanThailandTrinidad and TobagoTurkeyUgandaUkraineUruguayUzbekistanVenezuelaVietnamWest IndiesWestern AfricaWestern AsiaWestern EuropeYemenZaireZimbabweAzores
Immigrants from Peru
Race
Ancestry
AfghanAfricanAlaska NativeAlaskan AthabascanAlbanianAleutAlsatianAmericanApacheArabArapahoArgentineanArmenianAssyrian/Chaldean/SyriacAustralianAustrianBahamianBangladeshiBarbadianBasqueBelgianBelizeanBermudanBhutaneseBlackfeetBolivianBrazilianBritishBritish West IndianBulgarianBurmeseCajunCambodianCanadianCape VerdeanCelticCentral AmericanCentral American IndianCherokeeCheyenneChickasawChileanChineseChippewaChoctawColombianColvilleComancheCosta RicanCreeCreekCroatianCrowCubanCypriotCzechCzechoslovakianDanishDelawareDominicanDutchDutch West IndianEastern EuropeanEcuadorianEgyptianEnglishEstonianEthiopianEuropeanFijianFilipinoFinnishFrenchFrench American IndianFrench CanadianGermanGerman RussianGhanaianGreekGuamanian/ChamorroGuatemalanGuyaneseHaitianHmongHonduranHopiHoumaHungarianIcelanderIndian (Asian)IndonesianInupiatIranianIraqiIrishIroquoisIsraeliItalianJamaicanJapaneseJordanianKenyanKiowaKoreanLaotianLatvianLebaneseLiberianLithuanianLumbeeLuxembourgerMacedonianMalaysianMalteseMarshalleseMenomineeMexicanMexican American IndianMongolianMoroccanNative HawaiianNavajoNepaleseNew ZealanderNicaraguanNigerianNorthern EuropeanNorwegianOkinawanOsageOttawaPaiutePakistaniPalestinianPanamanianParaguayanPennsylvania GermanPeruvianPimaPolishPortuguesePotawatomiPuebloPuerto RicanPuget Sound SalishRomanianRussianSalvadoranSamoanScandinavianScotch-IrishScottishSeminoleSenegaleseSerbianShoshoneSierra LeoneanSiouxSlavicSlovakSloveneSomaliSouth AfricanSouth AmericanSouth American IndianSoviet UnionSpaniardSpanishSpanish AmericanSpanish American IndianSri LankanSubsaharan AfricanSudaneseSwedishSwissSyrianTaiwaneseThaiTlingit-HaidaTohono O'OdhamTonganTrinidadian and TobagonianTsimshianTurkishU.S. Virgin IslanderUgandanUkrainianUruguayanUteVenezuelanVietnameseWelshWest IndianYakamaYaquiYugoslavianYumanYup'ikZimbabwean
Immigration
NonimmigrantsImmigrantsAfghanistanAfricaAlbaniaArgentinaArmeniaAsiaAustraliaAustriaBahamasBangladeshBarbadosBelarusBelgiumBelizeBoliviaBosnia and HerzegovinaBrazilBulgariaBurma/MyanmarCabo VerdeCambodiaCameroonCanadaCaribbeanCentral AmericaChileChinaColombiaCongoCosta RicaCroatiaCubaCzechoslovakiaDenmarkDominicaDominican RepublicEastern AfricaEastern AsiaEastern EuropeEcuadorEgyptEl SalvadorEnglandEritreaEthiopiaEuropeFijiFranceGermanyGhanaGreeceGrenadaGuatemalaGuyanaHaitiHondurasHong KongHungaryIndiaIndonesiaIranIraqIrelandIsraelItalyJamaicaJapanJordanKazakhstanKenyaKoreaKuwaitLaosLatin AmericaLatviaLebanonLiberiaLithuaniaMalaysiaMexicoMicronesiaMiddle AfricaMoldovaMoroccoNepalNetherlandsNicaraguaNigeriaNorth AmericaNorth MacedoniaNorthern AfricaNorthern EuropeNorwayOceaniaPakistanPanamaPeruPhilippinesPolandPortugalRomaniaRussiaSaudi ArabiaScotlandSenegalSerbiaSierra LeoneSingaporeSomaliaSouth AfricaSouth AmericaSouth Central AsiaSouth Eastern AsiaSouthern EuropeSpainSri LankaSt. Vincent and the GrenadinesSudanSwedenSwitzerlandSyriaTaiwanThailandTrinidad and TobagoTurkeyUgandaUkraineUruguayUzbekistanVenezuelaVietnamWest IndiesWestern AfricaWestern AsiaWestern EuropeYemenZaireZimbabweAzores
Unemployment Among Ages 65 to 74 years
Income
Poverty
Unemployment
Labor Participation
Family Structure
Vehicle Availability
Education Level
Disability

Unemployment Among Ages 65 to 74 years Comparison

Carpatho Rusyns

Immigrants from Peru

Exceptional
Tragic
5.1%
UNEMPLOYMENT AMONG AGES 65 TO 74 YEARS
99.6/ 100
METRIC RATING
55th/ 347
METRIC RANK
5.6%
UNEMPLOYMENT AMONG AGES 65 TO 74 YEARS
1.3/ 100
METRIC RATING
243rd/ 347
METRIC RANK

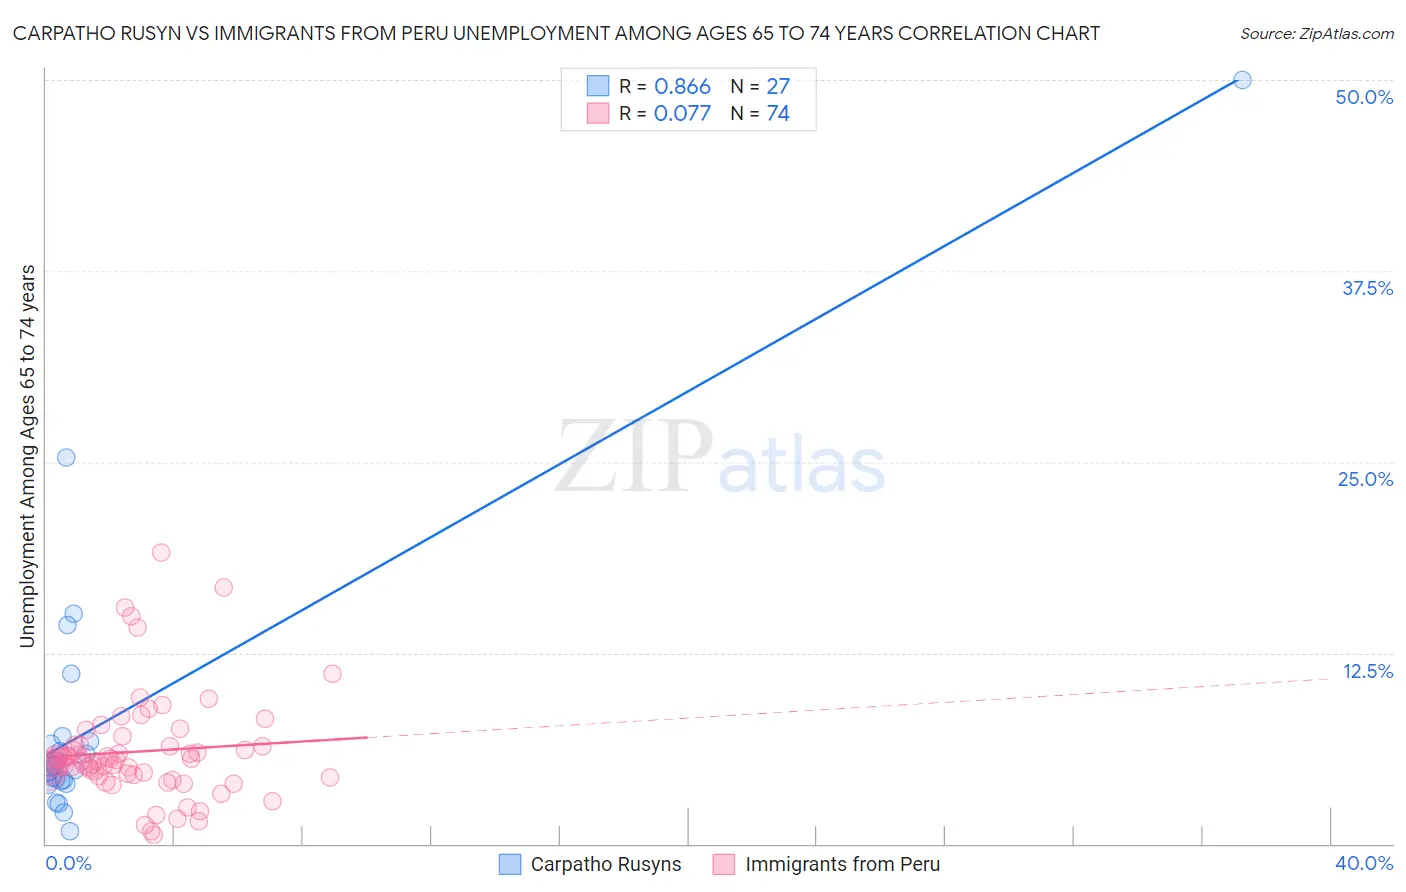
Carpatho Rusyn vs Immigrants from Peru Unemployment Among Ages 65 to 74 years Correlation Chart

The statistical analysis conducted on geographies consisting of 56,803,186 people shows a very strong positive correlation between the proportion of Carpatho Rusyns and unemployment rate among population between the ages 65 and 74 in the United States with a correlation coefficient (R) of 0.866 and weighted average of 5.1%. Similarly, the statistical analysis conducted on geographies consisting of 299,952,352 people shows a slight positive correlation between the proportion of Immigrants from Peru and unemployment rate among population between the ages 65 and 74 in the United States with a correlation coefficient (R) of 0.077 and weighted average of 5.6%, a difference of 8.5%.
Carpatho Rusyn vs Immigrants from Peru Unemployment Among Ages 65 to 74 years

Unemployment Among Ages 65 to 74 years Correlation Summary

MeasurementCarpatho RusynImmigrants from Peru
Minimum0.80%0.60%
Maximum50.0%19.1%
Range49.2%18.5%
Mean8.0%6.0%
Median5.0%5.4%
Interquartile 25% (IQ1)4.1%4.5%
Interquartile 75% (IQ3)6.7%6.5%
Interquartile Range (IQR)2.6%1.9%
Standard Deviation (Sample)9.8%3.4%
Standard Deviation (Population)9.6%3.4%

Similar Demographics by Unemployment Among Ages 65 to 74 years

Demographics Similar to Carpatho Rusyns by Unemployment Among Ages 65 to 74 years

In terms of unemployment among ages 65 to 74 years, the demographic groups most similar to Carpatho Rusyns are Swedish (5.1%, a difference of 0.080%), Croatian (5.1%, a difference of 0.080%), Immigrants from Nicaragua (5.1%, a difference of 0.090%), Immigrants from Ethiopia (5.1%, a difference of 0.11%), and European (5.1%, a difference of 0.12%).
DemographicsRating | RankUnemployment Among Ages 65 to 74 years
Choctaw
99.8
/100
|
#48
Exceptional
5.1%
Immigrants | Austria
99.8
/100
|
#49
Exceptional
5.1%
Immigrants | Zimbabwe
99.7
/100
|
#50
Exceptional
5.1%
Immigrants | Kazakhstan
99.7
/100
|
#51
Exceptional
5.1%
Europeans
99.6
/100
|
#52
Exceptional
5.1%
Immigrants | Ethiopia
99.6
/100
|
#53
Exceptional
5.1%
Immigrants | Nicaragua
99.6
/100
|
#54
Exceptional
5.1%
Carpatho Rusyns
99.6
/100
|
#55
Exceptional
5.1%
Swedes
99.5
/100
|
#56
Exceptional
5.1%
Croatians
99.5
/100
|
#57
Exceptional
5.1%
Germans
99.5
/100
|
#58
Exceptional
5.1%
Immigrants | Bulgaria
99.4
/100
|
#59
Exceptional
5.1%
Immigrants | Jordan
99.4
/100
|
#60
Exceptional
5.1%
Immigrants | Taiwan
99.4
/100
|
#61
Exceptional
5.1%
Nicaraguans
99.4
/100
|
#62
Exceptional
5.1%

Demographics Similar to Immigrants from Peru by Unemployment Among Ages 65 to 74 years

In terms of unemployment among ages 65 to 74 years, the demographic groups most similar to Immigrants from Peru are Cree (5.6%, a difference of 0.060%), Immigrants from Ghana (5.6%, a difference of 0.060%), Ghanaian (5.6%, a difference of 0.090%), German Russian (5.5%, a difference of 0.19%), and Cajun (5.5%, a difference of 0.27%).
DemographicsRating | RankUnemployment Among Ages 65 to 74 years
Hopi
2.2
/100
|
#236
Tragic
5.5%
Immigrants | Belize
2.2
/100
|
#237
Tragic
5.5%
Cajuns
1.8
/100
|
#238
Tragic
5.5%
German Russians
1.6
/100
|
#239
Tragic
5.5%
Ghanaians
1.4
/100
|
#240
Tragic
5.6%
Cree
1.4
/100
|
#241
Tragic
5.6%
Immigrants | Ghana
1.4
/100
|
#242
Tragic
5.6%
Immigrants | Peru
1.3
/100
|
#243
Tragic
5.6%
Immigrants | Micronesia
0.9
/100
|
#244
Tragic
5.6%
Immigrants | Greece
0.9
/100
|
#245
Tragic
5.6%
Paraguayans
0.9
/100
|
#246
Tragic
5.6%
Immigrants | Immigrants
0.9
/100
|
#247
Tragic
5.6%
Immigrants | Argentina
0.9
/100
|
#248
Tragic
5.6%
Trinidadians and Tobagonians
0.8
/100
|
#249
Tragic
5.6%
Cape Verdeans
0.7
/100
|
#250
Tragic
5.6%