Carpatho Rusyn vs Immigrants from Middle Africa Unemployment Among Ages 60 to 64 years

COMPARE

Carpatho Rusyn
Race
Ancestry
AfghanAfricanAlaska NativeAlaskan AthabascanAlbanianAleutAlsatianAmericanApacheArabArapahoArgentineanArmenianAssyrian/Chaldean/SyriacAustralianAustrianBahamianBangladeshiBarbadianBasqueBelgianBelizeanBermudanBhutaneseBlackfeetBolivianBrazilianBritishBritish West IndianBulgarianBurmeseCajunCambodianCanadianCape VerdeanCarpatho RusynCelticCentral AmericanCentral American IndianCherokeeCheyenneChickasawChileanChineseChippewaChoctawColombianColvilleComancheCosta RicanCreeCreekCroatianCrowCubanCypriotCzechCzechoslovakianDanishDelawareDominicanDutchDutch West IndianEastern EuropeanEcuadorianEgyptianEnglishEstonianEthiopianEuropeanFijianFilipinoFinnishFrenchFrench American IndianFrench CanadianGermanGerman RussianGhanaianGreekGuamanian/ChamorroGuatemalanGuyaneseHaitianHmongHonduranHopiHoumaHungarianIcelanderIndian (Asian)IndonesianInupiatIranianIraqiIrishIroquoisIsraeliItalianJamaicanJapaneseJordanianKenyanKiowaKoreanLaotianLatvianLebaneseLiberianLithuanianLumbeeLuxembourgerMacedonianMalaysianMalteseMarshalleseMenomineeMexicanMexican American IndianMongolianMoroccanNative HawaiianNavajoNepaleseNew ZealanderNicaraguanNigerianNorthern EuropeanNorwegianOkinawanOsageOttawaPaiutePakistaniPalestinianPanamanianParaguayanPennsylvania GermanPeruvianPimaPolishPortuguesePotawatomiPuebloPuerto RicanPuget Sound SalishRomanianRussianSalvadoranSamoanScandinavianScotch-IrishScottishSeminoleSenegaleseSerbianShoshoneSierra LeoneanSiouxSlavicSlovakSloveneSomaliSouth AfricanSouth AmericanSouth American IndianSoviet UnionSpaniardSpanishSpanish AmericanSpanish American IndianSri LankanSubsaharan AfricanSudaneseSwedishSwissSyrianTaiwaneseThaiTlingit-HaidaTohono O'OdhamTonganTrinidadian and TobagonianTsimshianTurkishU.S. Virgin IslanderUgandanUkrainianUruguayanUteVenezuelanVietnameseWelshWest IndianYakamaYaquiYugoslavianYumanYup'ikZimbabwean
Immigration
NonimmigrantsImmigrantsAfghanistanAfricaAlbaniaArgentinaArmeniaAsiaAustraliaAustriaBahamasBangladeshBarbadosBelarusBelgiumBelizeBoliviaBosnia and HerzegovinaBrazilBulgariaBurma/MyanmarCabo VerdeCambodiaCameroonCanadaCaribbeanCentral AmericaChileChinaColombiaCongoCosta RicaCroatiaCubaCzechoslovakiaDenmarkDominicaDominican RepublicEastern AfricaEastern AsiaEastern EuropeEcuadorEgyptEl SalvadorEnglandEritreaEthiopiaEuropeFijiFranceGermanyGhanaGreeceGrenadaGuatemalaGuyanaHaitiHondurasHong KongHungaryIndiaIndonesiaIranIraqIrelandIsraelItalyJamaicaJapanJordanKazakhstanKenyaKoreaKuwaitLaosLatin AmericaLatviaLebanonLiberiaLithuaniaMalaysiaMexicoMicronesiaMoldovaMoroccoNepalNetherlandsNicaraguaNigeriaNorth AmericaNorth MacedoniaNorthern AfricaNorthern EuropeNorwayOceaniaPakistanPanamaPeruPhilippinesPolandPortugalRomaniaRussiaSaudi ArabiaScotlandSenegalSerbiaSierra LeoneSingaporeSomaliaSouth AfricaSouth AmericaSouth Central AsiaSouth Eastern AsiaSouthern EuropeSpainSri LankaSt. Vincent and the GrenadinesSudanSwedenSwitzerlandSyriaTaiwanThailandTrinidad and TobagoTurkeyUgandaUkraineUruguayUzbekistanVenezuelaVietnamWest IndiesWestern AfricaWestern AsiaWestern EuropeYemenZaireZimbabweAzores
Immigrants from Middle Africa
Race
Ancestry
AfghanAfricanAlaska NativeAlaskan AthabascanAlbanianAleutAlsatianAmericanApacheArabArapahoArgentineanArmenianAssyrian/Chaldean/SyriacAustralianAustrianBahamianBangladeshiBarbadianBasqueBelgianBelizeanBermudanBhutaneseBlackfeetBolivianBrazilianBritishBritish West IndianBulgarianBurmeseCajunCambodianCanadianCape VerdeanCelticCentral AmericanCentral American IndianCherokeeCheyenneChickasawChileanChineseChippewaChoctawColombianColvilleComancheCosta RicanCreeCreekCroatianCrowCubanCypriotCzechCzechoslovakianDanishDelawareDominicanDutchDutch West IndianEastern EuropeanEcuadorianEgyptianEnglishEstonianEthiopianEuropeanFijianFilipinoFinnishFrenchFrench American IndianFrench CanadianGermanGerman RussianGhanaianGreekGuamanian/ChamorroGuatemalanGuyaneseHaitianHmongHonduranHopiHoumaHungarianIcelanderIndian (Asian)IndonesianInupiatIranianIraqiIrishIroquoisIsraeliItalianJamaicanJapaneseJordanianKenyanKiowaKoreanLaotianLatvianLebaneseLiberianLithuanianLumbeeLuxembourgerMacedonianMalaysianMalteseMarshalleseMenomineeMexicanMexican American IndianMongolianMoroccanNative HawaiianNavajoNepaleseNew ZealanderNicaraguanNigerianNorthern EuropeanNorwegianOkinawanOsageOttawaPaiutePakistaniPalestinianPanamanianParaguayanPennsylvania GermanPeruvianPimaPolishPortuguesePotawatomiPuebloPuerto RicanPuget Sound SalishRomanianRussianSalvadoranSamoanScandinavianScotch-IrishScottishSeminoleSenegaleseSerbianShoshoneSierra LeoneanSiouxSlavicSlovakSloveneSomaliSouth AfricanSouth AmericanSouth American IndianSoviet UnionSpaniardSpanishSpanish AmericanSpanish American IndianSri LankanSubsaharan AfricanSudaneseSwedishSwissSyrianTaiwaneseThaiTlingit-HaidaTohono O'OdhamTonganTrinidadian and TobagonianTsimshianTurkishU.S. Virgin IslanderUgandanUkrainianUruguayanUteVenezuelanVietnameseWelshWest IndianYakamaYaquiYugoslavianYumanYup'ikZimbabwean
Immigration
NonimmigrantsImmigrantsAfghanistanAfricaAlbaniaArgentinaArmeniaAsiaAustraliaAustriaBahamasBangladeshBarbadosBelarusBelgiumBelizeBoliviaBosnia and HerzegovinaBrazilBulgariaBurma/MyanmarCabo VerdeCambodiaCameroonCanadaCaribbeanCentral AmericaChileChinaColombiaCongoCosta RicaCroatiaCubaCzechoslovakiaDenmarkDominicaDominican RepublicEastern AfricaEastern AsiaEastern EuropeEcuadorEgyptEl SalvadorEnglandEritreaEthiopiaEuropeFijiFranceGermanyGhanaGreeceGrenadaGuatemalaGuyanaHaitiHondurasHong KongHungaryIndiaIndonesiaIranIraqIrelandIsraelItalyJamaicaJapanJordanKazakhstanKenyaKoreaKuwaitLaosLatin AmericaLatviaLebanonLiberiaLithuaniaMalaysiaMexicoMicronesiaMiddle AfricaMoldovaMoroccoNepalNetherlandsNicaraguaNigeriaNorth AmericaNorth MacedoniaNorthern AfricaNorthern EuropeNorwayOceaniaPakistanPanamaPeruPhilippinesPolandPortugalRomaniaRussiaSaudi ArabiaScotlandSenegalSerbiaSierra LeoneSingaporeSomaliaSouth AfricaSouth AmericaSouth Central AsiaSouth Eastern AsiaSouthern EuropeSpainSri LankaSt. Vincent and the GrenadinesSudanSwedenSwitzerlandSyriaTaiwanThailandTrinidad and TobagoTurkeyUgandaUkraineUruguayUzbekistanVenezuelaVietnamWest IndiesWestern AfricaWestern AsiaWestern EuropeYemenZaireZimbabweAzores
Unemployment Among Ages 60 to 64 years
Income
Poverty
Unemployment
Labor Participation
Family Structure
Vehicle Availability
Education Level
Disability

Unemployment Among Ages 60 to 64 years Comparison

Carpatho Rusyns

Immigrants from Middle Africa

Exceptional
Exceptional
4.5%
UNEMPLOYMENT AMONG AGES 60 TO 64 YEARS
100.0/ 100
METRIC RATING
33rd/ 347
METRIC RANK
4.6%
UNEMPLOYMENT AMONG AGES 60 TO 64 YEARS
99.7/ 100
METRIC RATING
64th/ 347
METRIC RANK

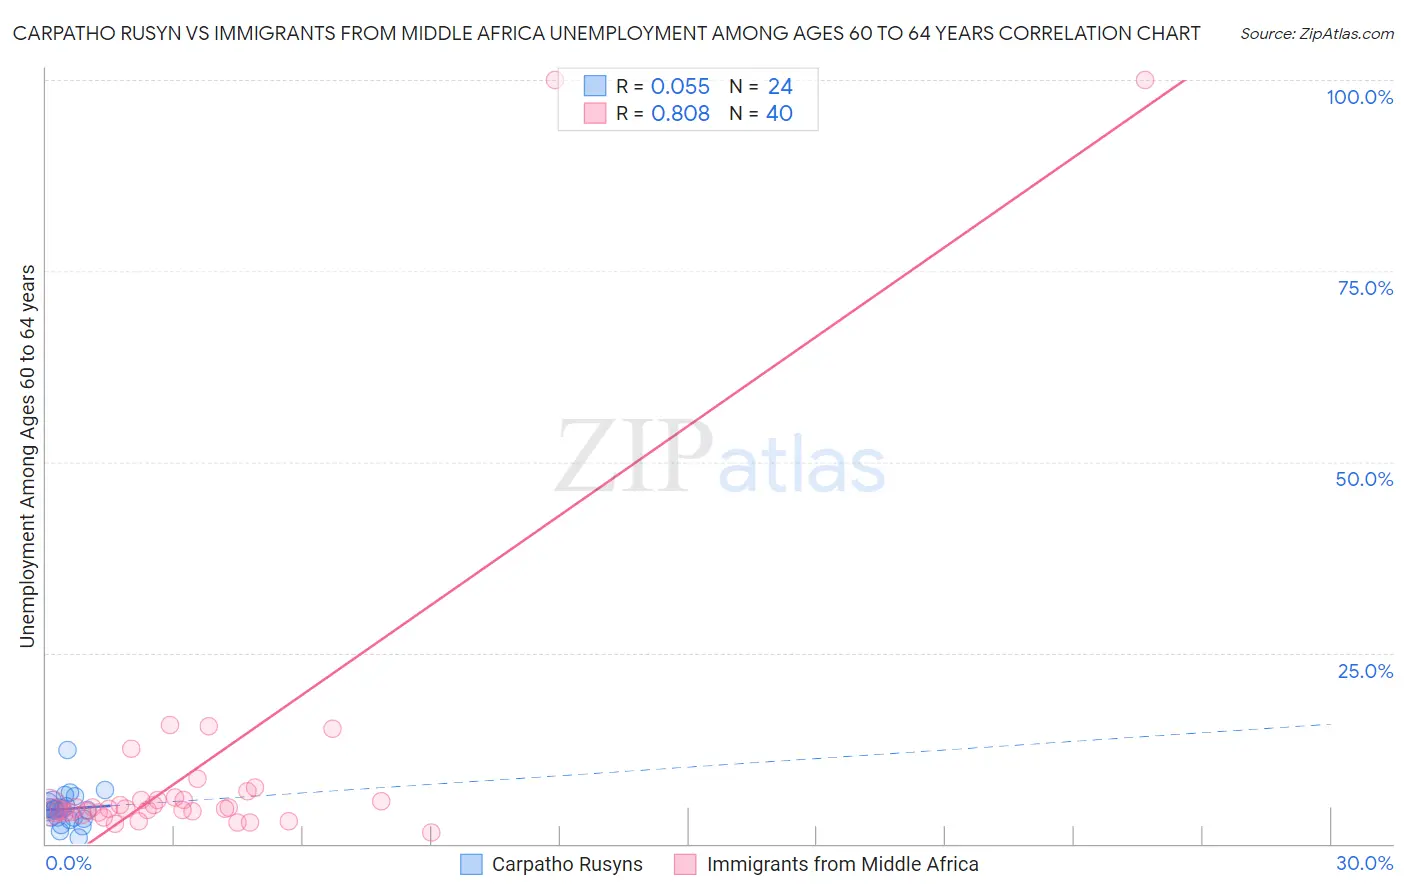
Carpatho Rusyn vs Immigrants from Middle Africa Unemployment Among Ages 60 to 64 years Correlation Chart

The statistical analysis conducted on geographies consisting of 57,468,302 people shows a slight positive correlation between the proportion of Carpatho Rusyns and unemployment rate among population between the ages 60 and 64 in the United States with a correlation coefficient (R) of 0.055 and weighted average of 4.5%. Similarly, the statistical analysis conducted on geographies consisting of 191,643,195 people shows a very strong positive correlation between the proportion of Immigrants from Middle Africa and unemployment rate among population between the ages 60 and 64 in the United States with a correlation coefficient (R) of 0.808 and weighted average of 4.6%, a difference of 2.9%.
Carpatho Rusyn vs Immigrants from Middle Africa Unemployment Among Ages 60 to 64 years

Unemployment Among Ages 60 to 64 years Correlation Summary

MeasurementCarpatho RusynImmigrants from Middle Africa
Minimum0.80%1.4%
Maximum12.2%100.0%
Range11.4%98.6%
Mean4.6%10.3%
Median4.5%4.7%
Interquartile 25% (IQ1)3.3%4.1%
Interquartile 75% (IQ3)5.4%5.8%
Interquartile Range (IQR)2.0%1.7%
Standard Deviation (Sample)2.3%21.1%
Standard Deviation (Population)2.2%20.8%

Similar Demographics by Unemployment Among Ages 60 to 64 years

Demographics Similar to Carpatho Rusyns by Unemployment Among Ages 60 to 64 years

In terms of unemployment among ages 60 to 64 years, the demographic groups most similar to Carpatho Rusyns are Zimbabwean (4.5%, a difference of 0.050%), Immigrants from Eritrea (4.5%, a difference of 0.090%), Immigrants from Venezuela (4.5%, a difference of 0.16%), Cuban (4.5%, a difference of 0.18%), and Belgian (4.5%, a difference of 0.26%).
DemographicsRating | RankUnemployment Among Ages 60 to 64 years
Czechs
100.0
/100
|
#26
Exceptional
4.4%
Immigrants | Iraq
100.0
/100
|
#27
Exceptional
4.5%
Immigrants | Nepal
100.0
/100
|
#28
Exceptional
4.5%
Cubans
100.0
/100
|
#29
Exceptional
4.5%
Immigrants | Venezuela
100.0
/100
|
#30
Exceptional
4.5%
Immigrants | Eritrea
100.0
/100
|
#31
Exceptional
4.5%
Zimbabweans
100.0
/100
|
#32
Exceptional
4.5%
Carpatho Rusyns
100.0
/100
|
#33
Exceptional
4.5%
Belgians
100.0
/100
|
#34
Exceptional
4.5%
Germans
100.0
/100
|
#35
Exceptional
4.5%
Venezuelans
100.0
/100
|
#36
Exceptional
4.5%
Immigrants | Portugal
100.0
/100
|
#37
Exceptional
4.5%
Native Hawaiians
100.0
/100
|
#38
Exceptional
4.5%
Iraqis
100.0
/100
|
#39
Exceptional
4.5%
Scandinavians
100.0
/100
|
#40
Exceptional
4.5%

Demographics Similar to Immigrants from Middle Africa by Unemployment Among Ages 60 to 64 years

In terms of unemployment among ages 60 to 64 years, the demographic groups most similar to Immigrants from Middle Africa are Czechoslovakian (4.6%, a difference of 0.020%), Jordanian (4.6%, a difference of 0.020%), Senegalese (4.6%, a difference of 0.050%), Lebanese (4.6%, a difference of 0.15%), and Hawaiian (4.6%, a difference of 0.23%).
DemographicsRating | RankUnemployment Among Ages 60 to 64 years
British
99.9
/100
|
#57
Exceptional
4.6%
Immigrants | India
99.8
/100
|
#58
Exceptional
4.6%
Swiss
99.8
/100
|
#59
Exceptional
4.6%
Puget Sound Salish
99.8
/100
|
#60
Exceptional
4.6%
Lebanese
99.8
/100
|
#61
Exceptional
4.6%
Senegalese
99.7
/100
|
#62
Exceptional
4.6%
Czechoslovakians
99.7
/100
|
#63
Exceptional
4.6%
Immigrants | Middle Africa
99.7
/100
|
#64
Exceptional
4.6%
Jordanians
99.7
/100
|
#65
Exceptional
4.6%
Hawaiians
99.6
/100
|
#66
Exceptional
4.6%
Immigrants | Scotland
99.6
/100
|
#67
Exceptional
4.6%
Immigrants | Laos
99.6
/100
|
#68
Exceptional
4.6%
Creek
99.6
/100
|
#69
Exceptional
4.6%
Croatians
99.5
/100
|
#70
Exceptional
4.6%
Slavs
99.5
/100
|
#71
Exceptional
4.6%