Cape Verdean vs New Zealander Unemployment Among Ages 20 to 24 years

COMPARE

Cape Verdean
Race
Ancestry
AfghanAfricanAlaska NativeAlaskan AthabascanAlbanianAleutAlsatianAmericanApacheArabArapahoArgentineanArmenianAssyrian/Chaldean/SyriacAustralianAustrianBahamianBangladeshiBarbadianBasqueBelgianBelizeanBermudanBhutaneseBlackfeetBolivianBrazilianBritishBritish West IndianBulgarianBurmeseCajunCambodianCanadianCape VerdeanCarpatho RusynCelticCentral AmericanCentral American IndianCherokeeCheyenneChickasawChileanChineseChippewaChoctawColombianColvilleComancheCosta RicanCreeCreekCroatianCrowCubanCypriotCzechCzechoslovakianDanishDelawareDominicanDutchDutch West IndianEastern EuropeanEcuadorianEgyptianEnglishEstonianEthiopianEuropeanFijianFilipinoFinnishFrenchFrench American IndianFrench CanadianGermanGerman RussianGhanaianGreekGuamanian/ChamorroGuatemalanGuyaneseHaitianHmongHonduranHopiHoumaHungarianIcelanderIndian (Asian)IndonesianInupiatIranianIraqiIrishIroquoisIsraeliItalianJamaicanJapaneseJordanianKenyanKiowaKoreanLaotianLatvianLebaneseLiberianLithuanianLumbeeLuxembourgerMacedonianMalaysianMalteseMarshalleseMenomineeMexicanMexican American IndianMongolianMoroccanNative HawaiianNavajoNepaleseNicaraguanNigerianNorthern EuropeanNorwegianOkinawanOsageOttawaPaiutePakistaniPalestinianPanamanianParaguayanPennsylvania GermanPeruvianPimaPolishPortuguesePotawatomiPuebloPuerto RicanPuget Sound SalishRomanianRussianSalvadoranSamoanScandinavianScotch-IrishScottishSeminoleSenegaleseSerbianShoshoneSierra LeoneanSiouxSlavicSlovakSloveneSomaliSouth AfricanSouth AmericanSouth American IndianSoviet UnionSpaniardSpanishSpanish AmericanSpanish American IndianSri LankanSubsaharan AfricanSudaneseSwedishSwissSyrianTaiwaneseThaiTlingit-HaidaTohono O'OdhamTonganTrinidadian and TobagonianTsimshianTurkishU.S. Virgin IslanderUgandanUkrainianUruguayanUteVenezuelanVietnameseWelshWest IndianYakamaYaquiYugoslavianYumanYup'ikZimbabwean
Immigration
NonimmigrantsImmigrantsAfghanistanAfricaAlbaniaArgentinaArmeniaAsiaAustraliaAustriaBahamasBangladeshBarbadosBelarusBelgiumBelizeBoliviaBosnia and HerzegovinaBrazilBulgariaBurma/MyanmarCabo VerdeCambodiaCameroonCanadaCaribbeanCentral AmericaChileChinaColombiaCongoCosta RicaCroatiaCubaCzechoslovakiaDenmarkDominicaDominican RepublicEastern AfricaEastern AsiaEastern EuropeEcuadorEgyptEl SalvadorEnglandEritreaEthiopiaEuropeFijiFranceGermanyGhanaGreeceGrenadaGuatemalaGuyanaHaitiHondurasHong KongHungaryIndiaIndonesiaIranIraqIrelandIsraelItalyJamaicaJapanJordanKazakhstanKenyaKoreaKuwaitLaosLatin AmericaLatviaLebanonLiberiaLithuaniaMalaysiaMexicoMicronesiaMiddle AfricaMoldovaMoroccoNepalNetherlandsNicaraguaNigeriaNorth AmericaNorth MacedoniaNorthern AfricaNorthern EuropeNorwayOceaniaPakistanPanamaPeruPhilippinesPolandPortugalRomaniaRussiaSaudi ArabiaScotlandSenegalSerbiaSierra LeoneSingaporeSomaliaSouth AfricaSouth AmericaSouth Central AsiaSouth Eastern AsiaSouthern EuropeSpainSri LankaSt. Vincent and the GrenadinesSudanSwedenSwitzerlandSyriaTaiwanThailandTrinidad and TobagoTurkeyUgandaUkraineUruguayUzbekistanVenezuelaVietnamWest IndiesWestern AfricaWestern AsiaWestern EuropeYemenZaireZimbabweAzores
New Zealander
Race
Ancestry
AfghanAfricanAlaska NativeAlaskan AthabascanAlbanianAleutAlsatianAmericanApacheArabArapahoArgentineanArmenianAssyrian/Chaldean/SyriacAustralianAustrianBahamianBangladeshiBarbadianBasqueBelgianBelizeanBermudanBhutaneseBlackfeetBolivianBrazilianBritishBritish West IndianBulgarianBurmeseCajunCambodianCanadianCarpatho RusynCelticCentral AmericanCentral American IndianCherokeeCheyenneChickasawChileanChineseChippewaChoctawColombianColvilleComancheCosta RicanCreeCreekCroatianCrowCubanCypriotCzechCzechoslovakianDanishDelawareDominicanDutchDutch West IndianEastern EuropeanEcuadorianEgyptianEnglishEstonianEthiopianEuropeanFijianFilipinoFinnishFrenchFrench American IndianFrench CanadianGermanGerman RussianGhanaianGreekGuamanian/ChamorroGuatemalanGuyaneseHaitianHmongHonduranHopiHoumaHungarianIcelanderIndian (Asian)IndonesianInupiatIranianIraqiIrishIroquoisIsraeliItalianJamaicanJapaneseJordanianKenyanKiowaKoreanLaotianLatvianLebaneseLiberianLithuanianLumbeeLuxembourgerMacedonianMalaysianMalteseMarshalleseMenomineeMexicanMexican American IndianMongolianMoroccanNative HawaiianNavajoNepaleseNew ZealanderNicaraguanNigerianNorthern EuropeanNorwegianOkinawanOsageOttawaPaiutePakistaniPalestinianPanamanianParaguayanPennsylvania GermanPeruvianPimaPolishPortuguesePotawatomiPuebloPuerto RicanPuget Sound SalishRomanianRussianSalvadoranSamoanScandinavianScotch-IrishScottishSeminoleSenegaleseSerbianShoshoneSierra LeoneanSiouxSlavicSlovakSloveneSomaliSouth AfricanSouth AmericanSouth American IndianSoviet UnionSpaniardSpanishSpanish AmericanSpanish American IndianSri LankanSubsaharan AfricanSudaneseSwedishSwissSyrianTaiwaneseThaiTlingit-HaidaTohono O'OdhamTonganTrinidadian and TobagonianTsimshianTurkishU.S. Virgin IslanderUgandanUkrainianUruguayanUteVenezuelanVietnameseWelshWest IndianYakamaYaquiYugoslavianYumanYup'ikZimbabwean
Immigration
NonimmigrantsImmigrantsAfghanistanAfricaAlbaniaArgentinaArmeniaAsiaAustraliaAustriaBahamasBangladeshBarbadosBelarusBelgiumBelizeBoliviaBosnia and HerzegovinaBrazilBulgariaBurma/MyanmarCabo VerdeCambodiaCameroonCanadaCaribbeanCentral AmericaChileChinaColombiaCongoCosta RicaCroatiaCubaCzechoslovakiaDenmarkDominicaDominican RepublicEastern AfricaEastern AsiaEastern EuropeEcuadorEgyptEl SalvadorEnglandEritreaEthiopiaEuropeFijiFranceGermanyGhanaGreeceGrenadaGuatemalaGuyanaHaitiHondurasHong KongHungaryIndiaIndonesiaIranIraqIrelandIsraelItalyJamaicaJapanJordanKazakhstanKenyaKoreaKuwaitLaosLatin AmericaLatviaLebanonLiberiaLithuaniaMalaysiaMexicoMicronesiaMiddle AfricaMoldovaMoroccoNepalNetherlandsNicaraguaNigeriaNorth AmericaNorth MacedoniaNorthern AfricaNorthern EuropeNorwayOceaniaPakistanPanamaPeruPhilippinesPolandPortugalRomaniaRussiaSaudi ArabiaScotlandSenegalSerbiaSierra LeoneSingaporeSomaliaSouth AfricaSouth AmericaSouth Central AsiaSouth Eastern AsiaSouthern EuropeSpainSri LankaSt. Vincent and the GrenadinesSudanSwedenSwitzerlandSyriaTaiwanThailandTrinidad and TobagoTurkeyUgandaUkraineUruguayUzbekistanVenezuelaVietnamWest IndiesWestern AfricaWestern AsiaWestern EuropeYemenZaireZimbabweAzores
Unemployment Among Ages 20 to 24 years
Income
Poverty
Unemployment
Labor Participation
Family Structure
Vehicle Availability
Education Level
Disability

Unemployment Among Ages 20 to 24 years Comparison

Cape Verdeans

New Zealanders

Tragic
Exceptional
11.5%
UNEMPLOYMENT AMONG AGES 20 TO 24 YEARS
0.0/ 100
METRIC RATING
274th/ 347
METRIC RANK
9.9%
UNEMPLOYMENT AMONG AGES 20 TO 24 YEARS
97.8/ 100
METRIC RATING
85th/ 347
METRIC RANK

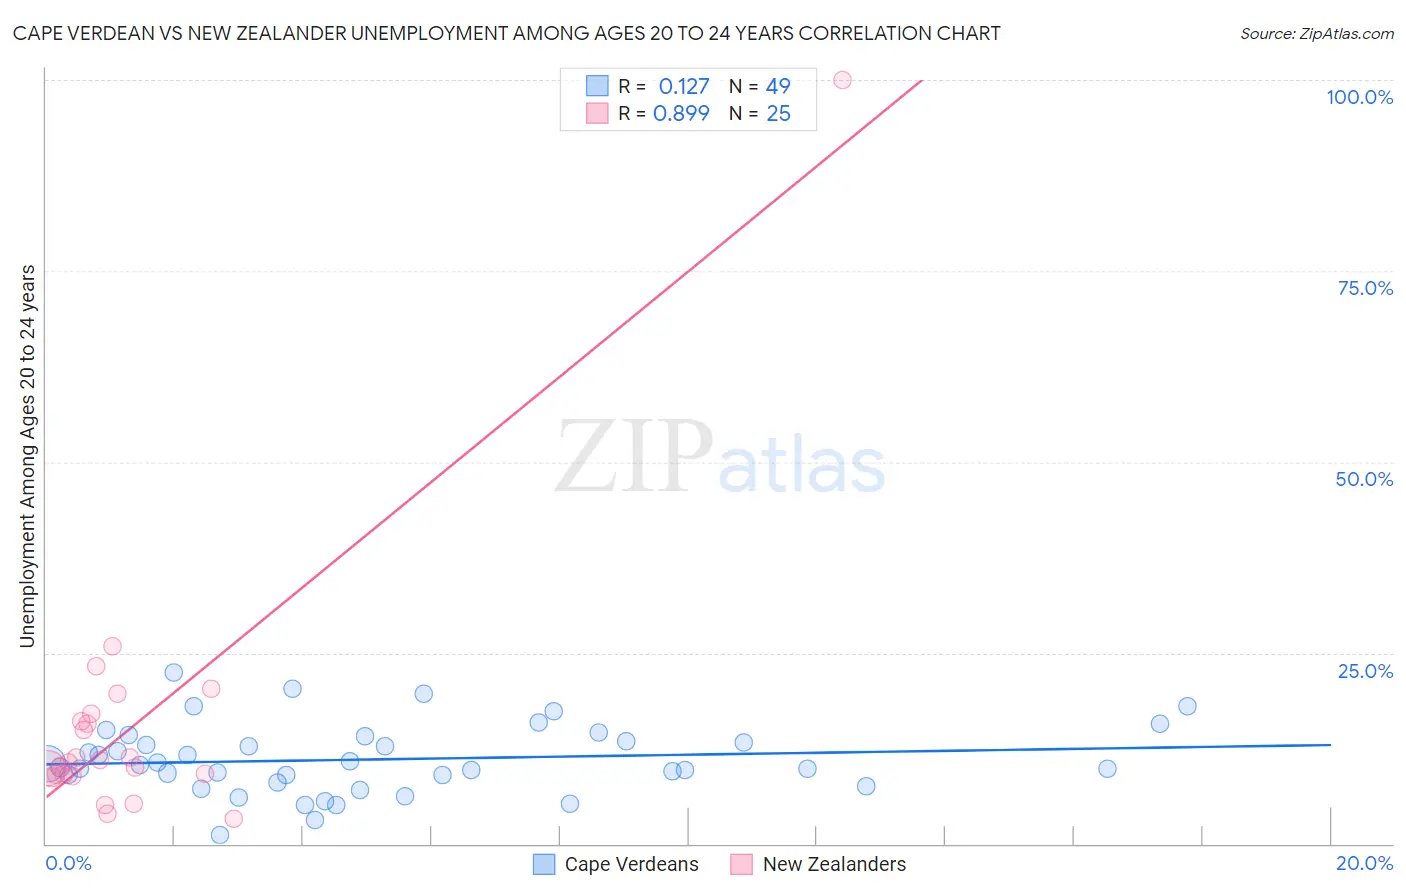
Cape Verdean vs New Zealander Unemployment Among Ages 20 to 24 years Correlation Chart

The statistical analysis conducted on geographies consisting of 106,606,919 people shows a poor positive correlation between the proportion of Cape Verdeans and unemployment rate among population between the ages 20 and 24 in the United States with a correlation coefficient (R) of 0.127 and weighted average of 11.5%. Similarly, the statistical analysis conducted on geographies consisting of 105,835,852 people shows a very strong positive correlation between the proportion of New Zealanders and unemployment rate among population between the ages 20 and 24 in the United States with a correlation coefficient (R) of 0.899 and weighted average of 9.9%, a difference of 15.5%.
Cape Verdean vs New Zealander Unemployment Among Ages 20 to 24 years

Unemployment Among Ages 20 to 24 years Correlation Summary

MeasurementCape VerdeanNew Zealander
Minimum1.2%3.3%
Maximum22.5%100.0%
Range21.3%96.7%
Mean11.0%15.6%
Median10.3%10.6%
Interquartile 25% (IQ1)8.5%9.0%
Interquartile 75% (IQ3)13.8%16.5%
Interquartile Range (IQR)5.3%7.5%
Standard Deviation (Sample)4.5%18.5%
Standard Deviation (Population)4.4%18.1%

Similar Demographics by Unemployment Among Ages 20 to 24 years

Demographics Similar to Cape Verdeans by Unemployment Among Ages 20 to 24 years

In terms of unemployment among ages 20 to 24 years, the demographic groups most similar to Cape Verdeans are Immigrants from Nigeria (11.5%, a difference of 0.080%), Senegalese (11.5%, a difference of 0.36%), Sierra Leonean (11.5%, a difference of 0.40%), African (11.5%, a difference of 0.54%), and Colville (11.6%, a difference of 0.57%).
DemographicsRating | RankUnemployment Among Ages 20 to 24 years
Immigrants | Greece
0.0
/100
|
#267
Tragic
11.1%
Maltese
0.0
/100
|
#268
Tragic
11.2%
Ute
0.0
/100
|
#269
Tragic
11.2%
Delaware
0.0
/100
|
#270
Tragic
11.3%
Immigrants | Uzbekistan
0.0
/100
|
#271
Tragic
11.4%
Nigerians
0.0
/100
|
#272
Tragic
11.4%
Immigrants | Nigeria
0.0
/100
|
#273
Tragic
11.5%
Cape Verdeans
0.0
/100
|
#274
Tragic
11.5%
Senegalese
0.0
/100
|
#275
Tragic
11.5%
Sierra Leoneans
0.0
/100
|
#276
Tragic
11.5%
Africans
0.0
/100
|
#277
Tragic
11.5%
Colville
0.0
/100
|
#278
Tragic
11.6%
Bahamians
0.0
/100
|
#279
Tragic
11.6%
Alaskan Athabascans
0.0
/100
|
#280
Tragic
11.6%
Armenians
0.0
/100
|
#281
Tragic
11.7%

Demographics Similar to New Zealanders by Unemployment Among Ages 20 to 24 years

In terms of unemployment among ages 20 to 24 years, the demographic groups most similar to New Zealanders are Immigrants from Bulgaria (9.9%, a difference of 0.050%), Latvian (9.9%, a difference of 0.050%), Sri Lankan (9.9%, a difference of 0.070%), Yaqui (9.9%, a difference of 0.080%), and Immigrants from Vietnam (10.0%, a difference of 0.15%).
DemographicsRating | RankUnemployment Among Ages 20 to 24 years
Assyrians/Chaldeans/Syriacs
98.3
/100
|
#78
Exceptional
9.9%
Icelanders
98.3
/100
|
#79
Exceptional
9.9%
Immigrants | Netherlands
98.2
/100
|
#80
Exceptional
9.9%
Yaqui
98.0
/100
|
#81
Exceptional
9.9%
Sri Lankans
98.0
/100
|
#82
Exceptional
9.9%
Immigrants | Bulgaria
98.0
/100
|
#83
Exceptional
9.9%
Latvians
97.9
/100
|
#84
Exceptional
9.9%
New Zealanders
97.8
/100
|
#85
Exceptional
9.9%
Immigrants | Vietnam
97.5
/100
|
#86
Exceptional
10.0%
Immigrants | Oceania
97.4
/100
|
#87
Exceptional
10.0%
Poles
97.1
/100
|
#88
Exceptional
10.0%
Macedonians
97.0
/100
|
#89
Exceptional
10.0%
Chileans
97.0
/100
|
#90
Exceptional
10.0%
Bhutanese
96.9
/100
|
#91
Exceptional
10.0%
Bangladeshis
96.9
/100
|
#92
Exceptional
10.0%