Cape Verdean vs African Unemployment Among Ages 16 to 19 years
COMPARE
Cape Verdean
African
Unemployment Among Ages 16 to 19 years
Unemployment Among Ages 16 to 19 years Comparison
Cape Verdeans
Africans
17.5%
UNEMPLOYMENT AMONG AGES 16 TO 19 YEARS
55.8/ 100
METRIC RATING
165th/ 347
METRIC RANK
19.5%
UNEMPLOYMENT AMONG AGES 16 TO 19 YEARS
0.0/ 100
METRIC RATING
278th/ 347
METRIC RANK
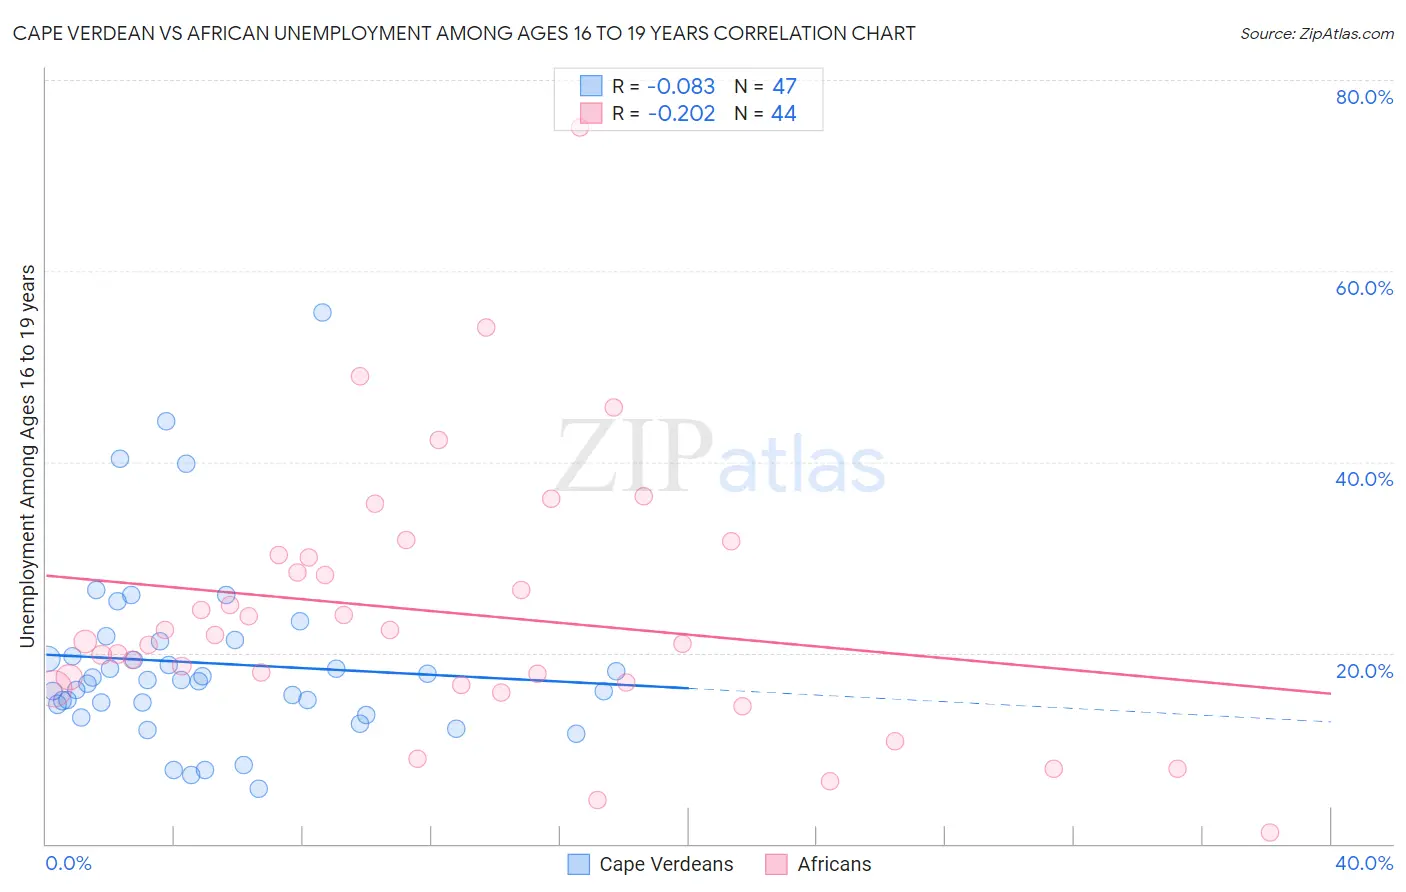
Cape Verdean vs African Unemployment Among Ages 16 to 19 years Correlation Chart
The statistical analysis conducted on geographies consisting of 105,654,451 people shows a slight negative correlation between the proportion of Cape Verdeans and unemployment rate among population between the ages 16 and 19 in the United States with a correlation coefficient (R) of -0.083 and weighted average of 17.5%. Similarly, the statistical analysis conducted on geographies consisting of 442,505,676 people shows a weak negative correlation between the proportion of Africans and unemployment rate among population between the ages 16 and 19 in the United States with a correlation coefficient (R) of -0.202 and weighted average of 19.5%, a difference of 11.2%.
Unemployment Among Ages 16 to 19 years Correlation Summary
| Measurement | Cape Verdean | African |
| Minimum | 5.7% | 1.2% |
| Maximum | 55.7% | 75.0% |
| Range | 50.0% | 73.8% |
| Mean | 18.9% | 24.2% |
| Median | 17.2% | 21.5% |
| Interquartile 25% (IQ1) | 14.6% | 16.7% |
| Interquartile 75% (IQ3) | 21.2% | 30.1% |
| Interquartile Range (IQR) | 6.6% | 13.4% |
| Standard Deviation (Sample) | 9.6% | 13.9% |
| Standard Deviation (Population) | 9.5% | 13.7% |
Similar Demographics by Unemployment Among Ages 16 to 19 years
Demographics Similar to Cape Verdeans by Unemployment Among Ages 16 to 19 years
In terms of unemployment among ages 16 to 19 years, the demographic groups most similar to Cape Verdeans are Immigrants from Italy (17.5%, a difference of 0.030%), Immigrants from France (17.5%, a difference of 0.040%), Immigrants from Hungary (17.5%, a difference of 0.050%), Immigrants from Cambodia (17.5%, a difference of 0.060%), and Immigrants from Austria (17.5%, a difference of 0.090%).
| Demographics | Rating | Rank | Unemployment Among Ages 16 to 19 years |
| Immigrants | China | 64.1 /100 | #158 | Good 17.5% |
| Koreans | 61.0 /100 | #159 | Good 17.5% |
| Ukrainians | 60.5 /100 | #160 | Good 17.5% |
| Immigrants | Denmark | 60.3 /100 | #161 | Good 17.5% |
| Immigrants | Norway | 59.8 /100 | #162 | Average 17.5% |
| Egyptians | 59.7 /100 | #163 | Average 17.5% |
| Immigrants | Austria | 57.7 /100 | #164 | Average 17.5% |
| Cape Verdeans | 55.8 /100 | #165 | Average 17.5% |
| Immigrants | Italy | 55.2 /100 | #166 | Average 17.5% |
| Immigrants | France | 54.9 /100 | #167 | Average 17.5% |
| Immigrants | Hungary | 54.7 /100 | #168 | Average 17.5% |
| Immigrants | Cambodia | 54.5 /100 | #169 | Average 17.5% |
| Immigrants | Romania | 53.3 /100 | #170 | Average 17.5% |
| Immigrants | Switzerland | 53.2 /100 | #171 | Average 17.5% |
| Immigrants | Western Europe | 52.2 /100 | #172 | Average 17.6% |
Demographics Similar to Africans by Unemployment Among Ages 16 to 19 years
In terms of unemployment among ages 16 to 19 years, the demographic groups most similar to Africans are Immigrants from Western Africa (19.4%, a difference of 0.23%), Ute (19.6%, a difference of 0.37%), Cajun (19.6%, a difference of 0.49%), Immigrants from Latin America (19.4%, a difference of 0.56%), and Paraguayan (19.4%, a difference of 0.65%).
| Demographics | Rating | Rank | Unemployment Among Ages 16 to 19 years |
| Blackfeet | 0.0 /100 | #271 | Tragic 19.2% |
| Hispanics or Latinos | 0.0 /100 | #272 | Tragic 19.2% |
| Immigrants | Panama | 0.0 /100 | #273 | Tragic 19.3% |
| Shoshone | 0.0 /100 | #274 | Tragic 19.3% |
| Paraguayans | 0.0 /100 | #275 | Tragic 19.4% |
| Immigrants | Latin America | 0.0 /100 | #276 | Tragic 19.4% |
| Immigrants | Western Africa | 0.0 /100 | #277 | Tragic 19.4% |
| Africans | 0.0 /100 | #278 | Tragic 19.5% |
| Ute | 0.0 /100 | #279 | Tragic 19.6% |
| Cajuns | 0.0 /100 | #280 | Tragic 19.6% |
| Cypriots | 0.0 /100 | #281 | Tragic 19.6% |
| Dutch West Indians | 0.0 /100 | #282 | Tragic 19.7% |
| Sioux | 0.0 /100 | #283 | Tragic 19.7% |
| Sierra Leoneans | 0.0 /100 | #284 | Tragic 19.7% |
| Ghanaians | 0.0 /100 | #285 | Tragic 19.8% |