Canadian vs Immigrants from Grenada Female Unemployment
COMPARE
Canadian
Immigrants from Grenada
Female Unemployment
Female Unemployment Comparison
Canadians
Immigrants from Grenada
5.0%
FEMALE UNEMPLOYMENT
97.2/ 100
METRIC RATING
84th/ 347
METRIC RANK
6.3%
FEMALE UNEMPLOYMENT
0.0/ 100
METRIC RATING
312th/ 347
METRIC RANK
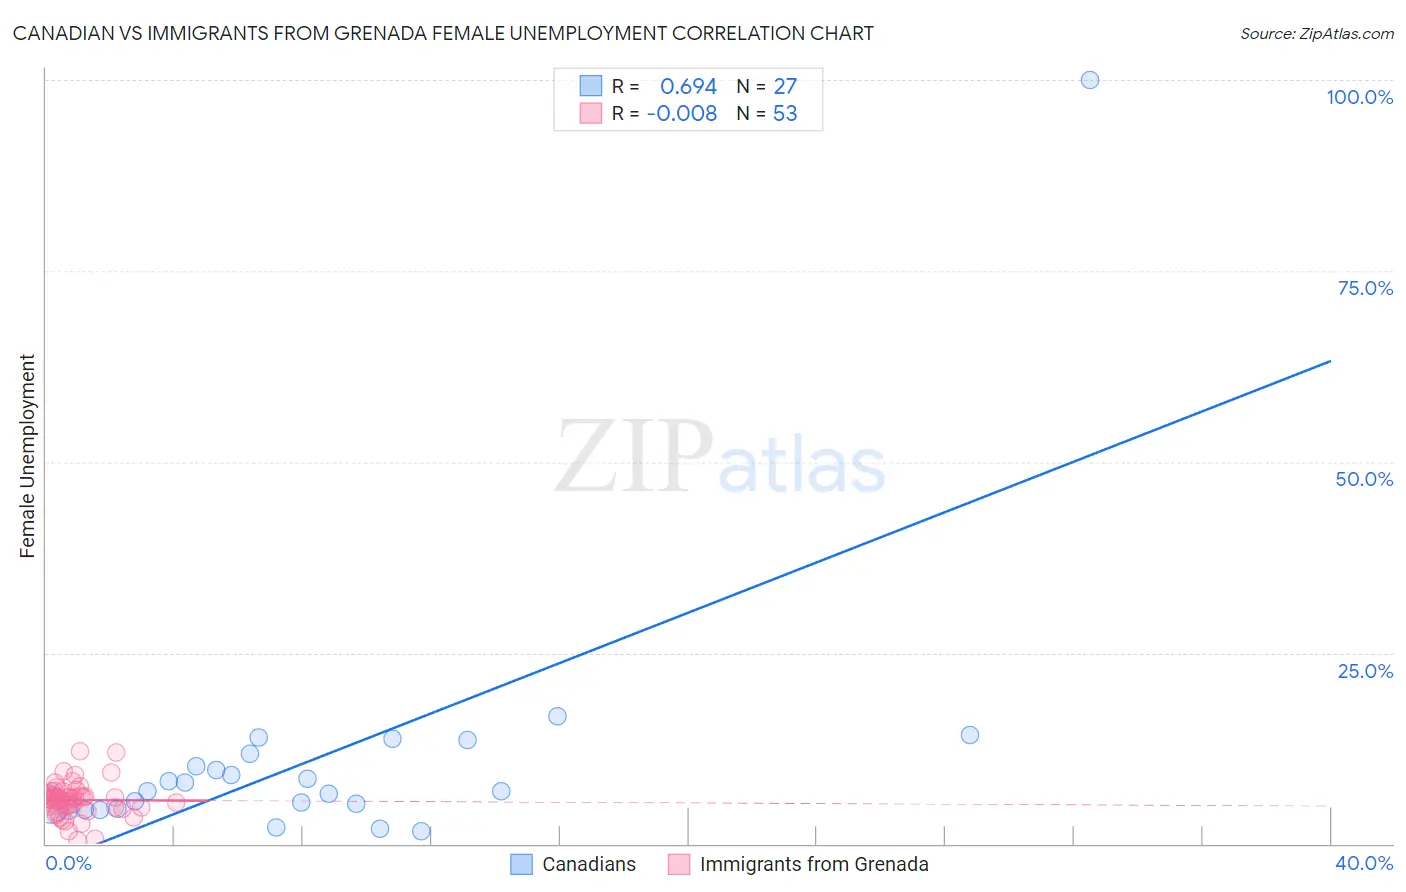
Canadian vs Immigrants from Grenada Female Unemployment Correlation Chart
The statistical analysis conducted on geographies consisting of 433,816,677 people shows a significant positive correlation between the proportion of Canadians and unemploymnet rate among females in the United States with a correlation coefficient (R) of 0.694 and weighted average of 5.0%. Similarly, the statistical analysis conducted on geographies consisting of 67,141,696 people shows no correlation between the proportion of Immigrants from Grenada and unemploymnet rate among females in the United States with a correlation coefficient (R) of -0.008 and weighted average of 6.3%, a difference of 27.4%.
Female Unemployment Correlation Summary
| Measurement | Canadian | Immigrants from Grenada |
| Minimum | 1.7% | 0.50% |
| Maximum | 100.0% | 12.1% |
| Range | 98.3% | 11.6% |
| Mean | 11.2% | 5.7% |
| Median | 6.9% | 5.9% |
| Interquartile 25% (IQ1) | 4.5% | 4.8% |
| Interquartile 75% (IQ3) | 11.8% | 6.7% |
| Interquartile Range (IQR) | 7.2% | 1.9% |
| Standard Deviation (Sample) | 18.2% | 2.2% |
| Standard Deviation (Population) | 17.9% | 2.2% |
Similar Demographics by Female Unemployment
Demographics Similar to Canadians by Female Unemployment
In terms of female unemployment, the demographic groups most similar to Canadians are Immigrants from Serbia (5.0%, a difference of 0.040%), Ukrainian (5.0%, a difference of 0.040%), Immigrants from Australia (5.0%, a difference of 0.050%), Bolivian (5.0%, a difference of 0.050%), and Filipino (5.0%, a difference of 0.10%).
| Demographics | Rating | Rank | Female Unemployment |
| Mongolians | 97.8 /100 | #77 | Exceptional 5.0% |
| Immigrants | Netherlands | 97.8 /100 | #78 | Exceptional 5.0% |
| Turks | 97.6 /100 | #79 | Exceptional 5.0% |
| New Zealanders | 97.4 /100 | #80 | Exceptional 5.0% |
| Filipinos | 97.3 /100 | #81 | Exceptional 5.0% |
| Immigrants | Australia | 97.3 /100 | #82 | Exceptional 5.0% |
| Immigrants | Serbia | 97.2 /100 | #83 | Exceptional 5.0% |
| Canadians | 97.2 /100 | #84 | Exceptional 5.0% |
| Ukrainians | 97.1 /100 | #85 | Exceptional 5.0% |
| Bolivians | 97.1 /100 | #86 | Exceptional 5.0% |
| Venezuelans | 96.9 /100 | #87 | Exceptional 5.0% |
| Immigrants | Sudan | 96.7 /100 | #88 | Exceptional 5.0% |
| Immigrants | Taiwan | 96.6 /100 | #89 | Exceptional 5.0% |
| Immigrants | Sweden | 96.3 /100 | #90 | Exceptional 5.0% |
| Immigrants | Japan | 96.0 /100 | #91 | Exceptional 5.0% |
Demographics Similar to Immigrants from Grenada by Female Unemployment
In terms of female unemployment, the demographic groups most similar to Immigrants from Grenada are Belizean (6.3%, a difference of 0.010%), Immigrants from Ecuador (6.4%, a difference of 0.24%), Pueblo (6.4%, a difference of 0.55%), Immigrants from Mexico (6.3%, a difference of 0.66%), and Central American Indian (6.3%, a difference of 0.79%).
| Demographics | Rating | Rank | Female Unemployment |
| Spanish American Indians | 0.0 /100 | #305 | Tragic 6.2% |
| Immigrants | Central America | 0.0 /100 | #306 | Tragic 6.2% |
| Shoshone | 0.0 /100 | #307 | Tragic 6.2% |
| Hispanics or Latinos | 0.0 /100 | #308 | Tragic 6.2% |
| Ecuadorians | 0.0 /100 | #309 | Tragic 6.3% |
| Central American Indians | 0.0 /100 | #310 | Tragic 6.3% |
| Immigrants | Mexico | 0.0 /100 | #311 | Tragic 6.3% |
| Immigrants | Grenada | 0.0 /100 | #312 | Tragic 6.3% |
| Belizeans | 0.0 /100 | #313 | Tragic 6.3% |
| Immigrants | Ecuador | 0.0 /100 | #314 | Tragic 6.4% |
| Pueblo | 0.0 /100 | #315 | Tragic 6.4% |
| Houma | 0.0 /100 | #316 | Tragic 6.4% |
| Immigrants | St. Vincent and the Grenadines | 0.0 /100 | #317 | Tragic 6.4% |
| British West Indians | 0.0 /100 | #318 | Tragic 6.4% |
| Immigrants | Bangladesh | 0.0 /100 | #319 | Tragic 6.5% |