Cambodian vs Immigrants from Middle Africa Unemployment Among Ages 25 to 29 years
COMPARE
Cambodian
Immigrants from Middle Africa
Unemployment Among Ages 25 to 29 years
Unemployment Among Ages 25 to 29 years Comparison
Cambodians
Immigrants from Middle Africa
5.8%
UNEMPLOYMENT AMONG AGES 25 TO 29 YEARS
100.0/ 100
METRIC RATING
11th/ 347
METRIC RANK
6.6%
UNEMPLOYMENT AMONG AGES 25 TO 29 YEARS
59.4/ 100
METRIC RATING
163rd/ 347
METRIC RANK
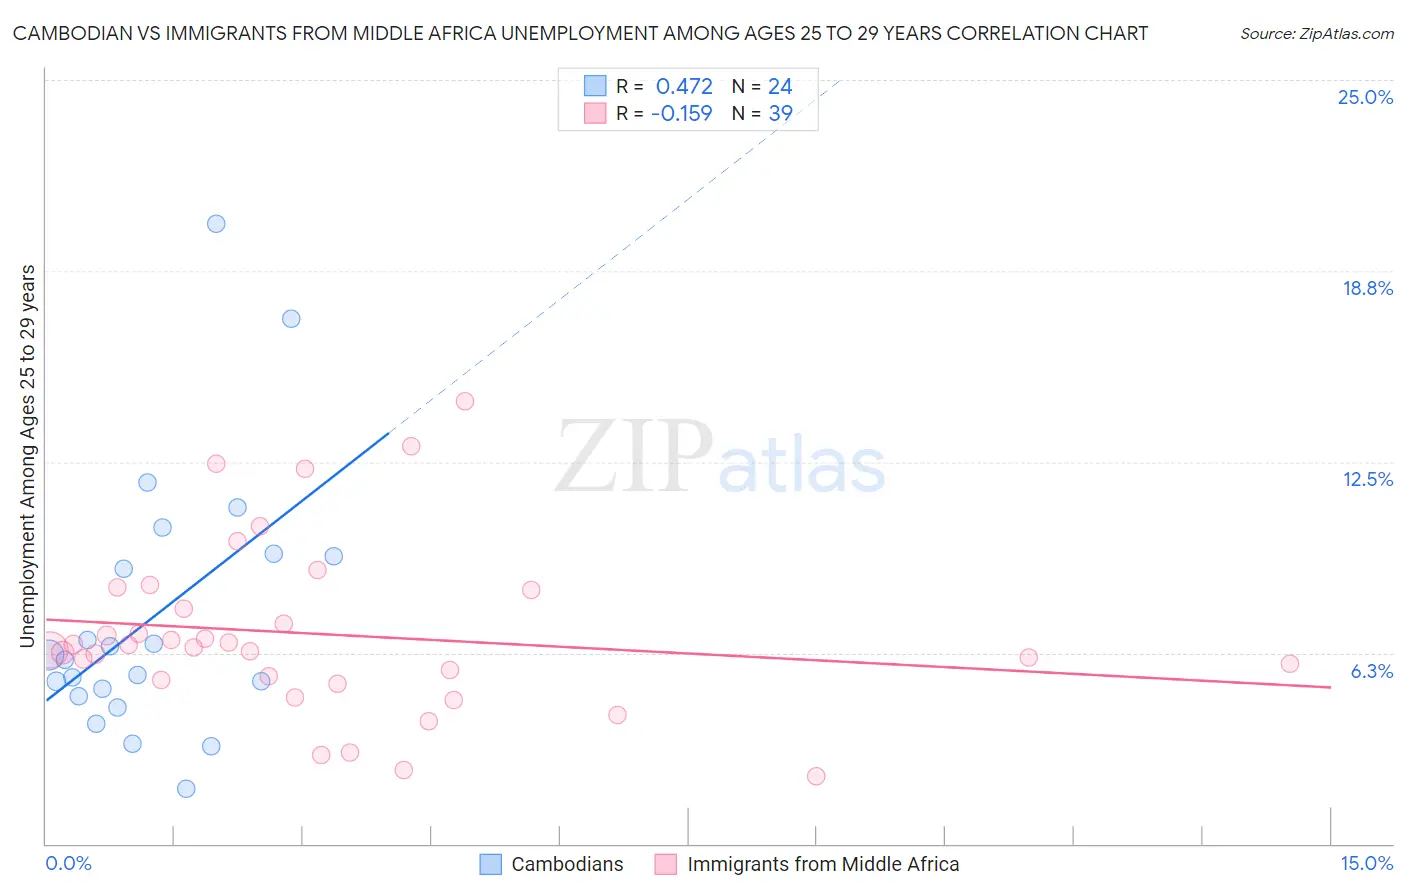
Cambodian vs Immigrants from Middle Africa Unemployment Among Ages 25 to 29 years Correlation Chart
The statistical analysis conducted on geographies consisting of 101,290,377 people shows a moderate positive correlation between the proportion of Cambodians and unemployment rate among population between the ages 25 and 29 in the United States with a correlation coefficient (R) of 0.472 and weighted average of 5.8%. Similarly, the statistical analysis conducted on geographies consisting of 198,840,985 people shows a poor negative correlation between the proportion of Immigrants from Middle Africa and unemployment rate among population between the ages 25 and 29 in the United States with a correlation coefficient (R) of -0.159 and weighted average of 6.6%, a difference of 13.1%.
Unemployment Among Ages 25 to 29 years Correlation Summary
| Measurement | Cambodian | Immigrants from Middle Africa |
| Minimum | 1.8% | 2.2% |
| Maximum | 20.3% | 14.5% |
| Range | 18.5% | 12.3% |
| Mean | 7.4% | 6.9% |
| Median | 6.1% | 6.4% |
| Interquartile 25% (IQ1) | 4.9% | 5.3% |
| Interquartile 75% (IQ3) | 9.4% | 8.3% |
| Interquartile Range (IQR) | 4.5% | 3.0% |
| Standard Deviation (Sample) | 4.3% | 2.8% |
| Standard Deviation (Population) | 4.3% | 2.8% |
Similar Demographics by Unemployment Among Ages 25 to 29 years
Demographics Similar to Cambodians by Unemployment Among Ages 25 to 29 years
In terms of unemployment among ages 25 to 29 years, the demographic groups most similar to Cambodians are Okinawan (5.9%, a difference of 0.12%), Immigrants from Bolivia (5.9%, a difference of 0.15%), Immigrants from Kuwait (5.9%, a difference of 0.78%), Immigrants from Sudan (5.8%, a difference of 1.1%), and Cuban (5.9%, a difference of 1.1%).
| Demographics | Rating | Rank | Unemployment Among Ages 25 to 29 years |
| Immigrants | Cuba | 100.0 /100 | #4 | Exceptional 5.6% |
| Somalis | 100.0 /100 | #5 | Exceptional 5.6% |
| Hmong | 100.0 /100 | #6 | Exceptional 5.7% |
| Immigrants | India | 100.0 /100 | #7 | Exceptional 5.7% |
| Immigrants | Bosnia and Herzegovina | 100.0 /100 | #8 | Exceptional 5.7% |
| Immigrants | Nepal | 100.0 /100 | #9 | Exceptional 5.7% |
| Immigrants | Sudan | 100.0 /100 | #10 | Exceptional 5.8% |
| Cambodians | 100.0 /100 | #11 | Exceptional 5.8% |
| Okinawans | 100.0 /100 | #12 | Exceptional 5.9% |
| Immigrants | Bolivia | 100.0 /100 | #13 | Exceptional 5.9% |
| Immigrants | Kuwait | 99.9 /100 | #14 | Exceptional 5.9% |
| Cubans | 99.9 /100 | #15 | Exceptional 5.9% |
| Immigrants | Bulgaria | 99.9 /100 | #16 | Exceptional 5.9% |
| Bolivians | 99.9 /100 | #17 | Exceptional 5.9% |
| Immigrants | Singapore | 99.9 /100 | #18 | Exceptional 5.9% |
Demographics Similar to Immigrants from Middle Africa by Unemployment Among Ages 25 to 29 years
In terms of unemployment among ages 25 to 29 years, the demographic groups most similar to Immigrants from Middle Africa are Immigrants from Czechoslovakia (6.6%, a difference of 0.050%), Greek (6.6%, a difference of 0.060%), Paraguayan (6.6%, a difference of 0.070%), Scottish (6.6%, a difference of 0.090%), and English (6.6%, a difference of 0.090%).
| Demographics | Rating | Rank | Unemployment Among Ages 25 to 29 years |
| Immigrants | Laos | 63.5 /100 | #156 | Good 6.6% |
| South Africans | 63.5 /100 | #157 | Good 6.6% |
| Immigrants | Russia | 61.5 /100 | #158 | Good 6.6% |
| Welsh | 61.3 /100 | #159 | Good 6.6% |
| Scottish | 60.7 /100 | #160 | Good 6.6% |
| Paraguayans | 60.4 /100 | #161 | Good 6.6% |
| Immigrants | Czechoslovakia | 60.2 /100 | #162 | Good 6.6% |
| Immigrants | Middle Africa | 59.4 /100 | #163 | Average 6.6% |
| Greeks | 58.5 /100 | #164 | Average 6.6% |
| English | 58.0 /100 | #165 | Average 6.6% |
| Immigrants | Northern Europe | 57.3 /100 | #166 | Average 6.6% |
| Immigrants | Canada | 55.0 /100 | #167 | Average 6.6% |
| Estonians | 54.8 /100 | #168 | Average 6.6% |
| South Americans | 54.5 /100 | #169 | Average 6.6% |
| Albanians | 53.5 /100 | #170 | Average 6.6% |