Cambodian vs German Unemployment Among Ages 65 to 74 years

COMPARE

Cambodian
Race
Ancestry
AfghanAfricanAlaska NativeAlaskan AthabascanAlbanianAleutAlsatianAmericanApacheArabArapahoArgentineanArmenianAssyrian/Chaldean/SyriacAustralianAustrianBahamianBangladeshiBarbadianBasqueBelgianBelizeanBermudanBhutaneseBlackfeetBolivianBrazilianBritishBritish West IndianBulgarianBurmeseCajunCambodianCanadianCape VerdeanCarpatho RusynCelticCentral AmericanCentral American IndianCherokeeCheyenneChickasawChileanChineseChippewaChoctawColombianColvilleComancheCosta RicanCreeCreekCroatianCrowCubanCypriotCzechCzechoslovakianDanishDelawareDominicanDutchDutch West IndianEastern EuropeanEcuadorianEgyptianEnglishEstonianEthiopianEuropeanFijianFilipinoFinnishFrenchFrench American IndianFrench CanadianGerman RussianGhanaianGreekGuamanian/ChamorroGuatemalanGuyaneseHaitianHmongHonduranHopiHoumaHungarianIcelanderIndian (Asian)IndonesianInupiatIranianIraqiIrishIroquoisIsraeliItalianJamaicanJapaneseJordanianKenyanKiowaKoreanLaotianLatvianLebaneseLiberianLithuanianLumbeeLuxembourgerMacedonianMalaysianMalteseMarshalleseMenomineeMexicanMexican American IndianMongolianMoroccanNative HawaiianNavajoNepaleseNew ZealanderNicaraguanNigerianNorthern EuropeanNorwegianOkinawanOsageOttawaPaiutePakistaniPalestinianPanamanianParaguayanPennsylvania GermanPeruvianPimaPolishPortuguesePotawatomiPuebloPuerto RicanPuget Sound SalishRomanianRussianSalvadoranSamoanScandinavianScotch-IrishScottishSeminoleSenegaleseSerbianShoshoneSierra LeoneanSiouxSlavicSlovakSloveneSomaliSouth AfricanSouth AmericanSouth American IndianSoviet UnionSpaniardSpanishSpanish AmericanSpanish American IndianSri LankanSubsaharan AfricanSudaneseSwedishSwissSyrianTaiwaneseThaiTlingit-HaidaTohono O'OdhamTonganTrinidadian and TobagonianTsimshianTurkishU.S. Virgin IslanderUgandanUkrainianUruguayanUteVenezuelanVietnameseWelshWest IndianYakamaYaquiYugoslavianYumanYup'ikZimbabwean
Immigration
NonimmigrantsImmigrantsAfghanistanAfricaAlbaniaArgentinaArmeniaAsiaAustraliaAustriaBahamasBangladeshBarbadosBelarusBelgiumBelizeBoliviaBosnia and HerzegovinaBrazilBulgariaBurma/MyanmarCabo VerdeCambodiaCameroonCanadaCaribbeanCentral AmericaChileChinaColombiaCongoCosta RicaCroatiaCubaCzechoslovakiaDenmarkDominicaDominican RepublicEastern AfricaEastern AsiaEastern EuropeEcuadorEgyptEl SalvadorEnglandEritreaEthiopiaEuropeFijiFranceGermanyGhanaGreeceGrenadaGuatemalaGuyanaHaitiHondurasHong KongHungaryIndiaIndonesiaIranIraqIrelandIsraelItalyJamaicaJapanJordanKazakhstanKenyaKoreaKuwaitLaosLatin AmericaLatviaLebanonLiberiaLithuaniaMalaysiaMexicoMicronesiaMiddle AfricaMoldovaMoroccoNepalNetherlandsNicaraguaNigeriaNorth AmericaNorth MacedoniaNorthern AfricaNorthern EuropeNorwayOceaniaPakistanPanamaPeruPhilippinesPolandPortugalRomaniaRussiaSaudi ArabiaScotlandSenegalSerbiaSierra LeoneSingaporeSomaliaSouth AfricaSouth AmericaSouth Central AsiaSouth Eastern AsiaSouthern EuropeSpainSri LankaSt. Vincent and the GrenadinesSudanSwedenSwitzerlandSyriaTaiwanThailandTrinidad and TobagoTurkeyUgandaUkraineUruguayUzbekistanVenezuelaVietnamWest IndiesWestern AfricaWestern AsiaWestern EuropeYemenZaireZimbabweAzores
German
Race
Ancestry
AfghanAfricanAlaska NativeAlaskan AthabascanAlbanianAleutAlsatianAmericanApacheArabArapahoArgentineanArmenianAssyrian/Chaldean/SyriacAustralianAustrianBahamianBangladeshiBarbadianBasqueBelgianBelizeanBermudanBhutaneseBlackfeetBolivianBrazilianBritishBritish West IndianBulgarianBurmeseCajunCanadianCape VerdeanCarpatho RusynCelticCentral AmericanCentral American IndianCherokeeCheyenneChickasawChileanChineseChippewaChoctawColombianColvilleComancheCosta RicanCreeCreekCroatianCrowCubanCypriotCzechCzechoslovakianDanishDelawareDominicanDutchDutch West IndianEastern EuropeanEcuadorianEgyptianEnglishEstonianEthiopianEuropeanFijianFilipinoFinnishFrenchFrench American IndianFrench CanadianGermanGerman RussianGhanaianGreekGuamanian/ChamorroGuatemalanGuyaneseHaitianHmongHonduranHopiHoumaHungarianIcelanderIndian (Asian)IndonesianInupiatIranianIraqiIrishIroquoisIsraeliItalianJamaicanJapaneseJordanianKenyanKiowaKoreanLaotianLatvianLebaneseLiberianLithuanianLumbeeLuxembourgerMacedonianMalaysianMalteseMarshalleseMenomineeMexicanMexican American IndianMongolianMoroccanNative HawaiianNavajoNepaleseNew ZealanderNicaraguanNigerianNorthern EuropeanNorwegianOkinawanOsageOttawaPaiutePakistaniPalestinianPanamanianParaguayanPennsylvania GermanPeruvianPimaPolishPortuguesePotawatomiPuebloPuerto RicanPuget Sound SalishRomanianRussianSalvadoranSamoanScandinavianScotch-IrishScottishSeminoleSenegaleseSerbianShoshoneSierra LeoneanSiouxSlavicSlovakSloveneSomaliSouth AfricanSouth AmericanSouth American IndianSoviet UnionSpaniardSpanishSpanish AmericanSpanish American IndianSri LankanSubsaharan AfricanSudaneseSwedishSwissSyrianTaiwaneseThaiTlingit-HaidaTohono O'OdhamTonganTrinidadian and TobagonianTsimshianTurkishU.S. Virgin IslanderUgandanUkrainianUruguayanUteVenezuelanVietnameseWelshWest IndianYakamaYaquiYugoslavianYumanYup'ikZimbabwean
Immigration
NonimmigrantsImmigrantsAfghanistanAfricaAlbaniaArgentinaArmeniaAsiaAustraliaAustriaBahamasBangladeshBarbadosBelarusBelgiumBelizeBoliviaBosnia and HerzegovinaBrazilBulgariaBurma/MyanmarCabo VerdeCambodiaCameroonCanadaCaribbeanCentral AmericaChileChinaColombiaCongoCosta RicaCroatiaCubaCzechoslovakiaDenmarkDominicaDominican RepublicEastern AfricaEastern AsiaEastern EuropeEcuadorEgyptEl SalvadorEnglandEritreaEthiopiaEuropeFijiFranceGermanyGhanaGreeceGrenadaGuatemalaGuyanaHaitiHondurasHong KongHungaryIndiaIndonesiaIranIraqIrelandIsraelItalyJamaicaJapanJordanKazakhstanKenyaKoreaKuwaitLaosLatin AmericaLatviaLebanonLiberiaLithuaniaMalaysiaMexicoMicronesiaMiddle AfricaMoldovaMoroccoNepalNetherlandsNicaraguaNigeriaNorth AmericaNorth MacedoniaNorthern AfricaNorthern EuropeNorwayOceaniaPakistanPanamaPeruPhilippinesPolandPortugalRomaniaRussiaSaudi ArabiaScotlandSenegalSerbiaSierra LeoneSingaporeSomaliaSouth AfricaSouth AmericaSouth Central AsiaSouth Eastern AsiaSouthern EuropeSpainSri LankaSt. Vincent and the GrenadinesSudanSwedenSwitzerlandSyriaTaiwanThailandTrinidad and TobagoTurkeyUgandaUkraineUruguayUzbekistanVenezuelaVietnamWest IndiesWestern AfricaWestern AsiaWestern EuropeYemenZaireZimbabweAzores
Unemployment Among Ages 65 to 74 years
Income
Poverty
Unemployment
Labor Participation
Family Structure
Vehicle Availability
Education Level
Disability

Unemployment Among Ages 65 to 74 years Comparison

Cambodians

Germans

Exceptional
Exceptional
5.0%
UNEMPLOYMENT AMONG AGES 65 TO 74 YEARS
100.0/ 100
METRIC RATING
34th/ 347
METRIC RANK
5.1%
UNEMPLOYMENT AMONG AGES 65 TO 74 YEARS
99.5/ 100
METRIC RATING
58th/ 347
METRIC RANK

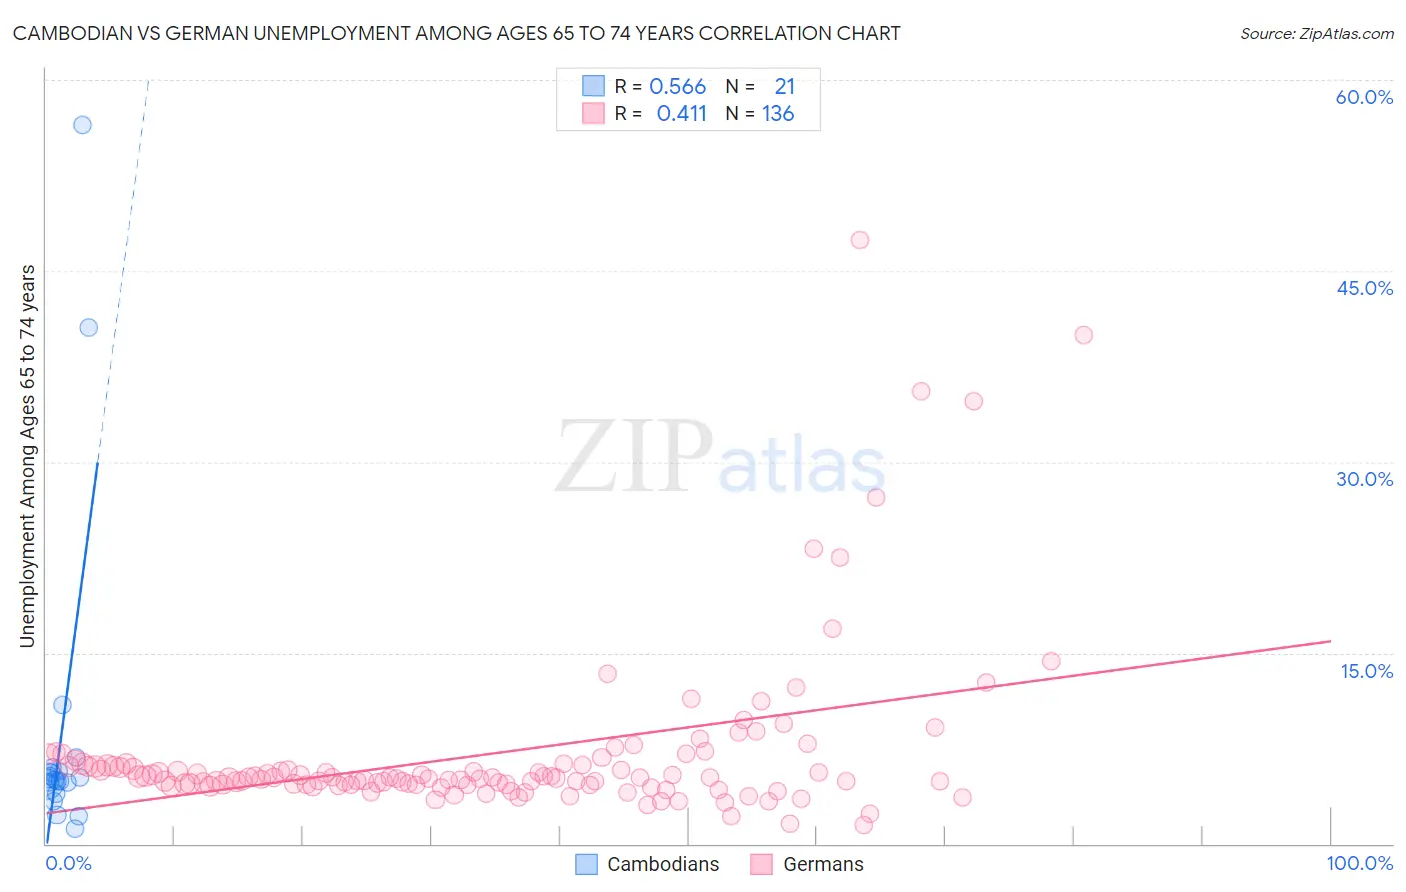
Cambodian vs German Unemployment Among Ages 65 to 74 years Correlation Chart

The statistical analysis conducted on geographies consisting of 98,775,189 people shows a substantial positive correlation between the proportion of Cambodians and unemployment rate among population between the ages 65 and 74 in the United States with a correlation coefficient (R) of 0.566 and weighted average of 5.0%. Similarly, the statistical analysis conducted on geographies consisting of 447,999,375 people shows a moderate positive correlation between the proportion of Germans and unemployment rate among population between the ages 65 and 74 in the United States with a correlation coefficient (R) of 0.411 and weighted average of 5.1%, a difference of 2.3%.
Cambodian vs German Unemployment Among Ages 65 to 74 years

Unemployment Among Ages 65 to 74 years Correlation Summary

MeasurementCambodianGerman
Minimum1.2%1.5%
Maximum56.5%47.4%
Range55.3%45.9%
Mean9.1%7.0%
Median5.0%5.2%
Interquartile 25% (IQ1)4.4%4.6%
Interquartile 75% (IQ3)5.8%6.2%
Interquartile Range (IQR)1.5%1.5%
Standard Deviation (Sample)13.5%6.7%
Standard Deviation (Population)13.2%6.7%

Similar Demographics by Unemployment Among Ages 65 to 74 years

Demographics Similar to Cambodians by Unemployment Among Ages 65 to 74 years

In terms of unemployment among ages 65 to 74 years, the demographic groups most similar to Cambodians are Belgian (5.0%, a difference of 0.0%), Palestinian (5.0%, a difference of 0.060%), Bhutanese (5.0%, a difference of 0.11%), Immigrants from Kuwait (5.0%, a difference of 0.30%), and Immigrants from Eastern Africa (5.0%, a difference of 0.31%).
DemographicsRating | RankUnemployment Among Ages 65 to 74 years
Norwegians
100.0
/100
|
#27
Exceptional
5.0%
Bulgarians
100.0
/100
|
#28
Exceptional
5.0%
Ethiopians
100.0
/100
|
#29
Exceptional
5.0%
Immigrants | Lebanon
100.0
/100
|
#30
Exceptional
5.0%
Slovenes
100.0
/100
|
#31
Exceptional
5.0%
Palestinians
100.0
/100
|
#32
Exceptional
5.0%
Belgians
100.0
/100
|
#33
Exceptional
5.0%
Cambodians
100.0
/100
|
#34
Exceptional
5.0%
Bhutanese
100.0
/100
|
#35
Exceptional
5.0%
Immigrants | Kuwait
99.9
/100
|
#36
Exceptional
5.0%
Immigrants | Eastern Africa
99.9
/100
|
#37
Exceptional
5.0%
Nepalese
99.9
/100
|
#38
Exceptional
5.0%
Immigrants | Sweden
99.9
/100
|
#39
Exceptional
5.0%
Immigrants | Iraq
99.9
/100
|
#40
Exceptional
5.1%
Ugandans
99.9
/100
|
#41
Exceptional
5.1%

Demographics Similar to Germans by Unemployment Among Ages 65 to 74 years

In terms of unemployment among ages 65 to 74 years, the demographic groups most similar to Germans are Swedish (5.1%, a difference of 0.050%), Croatian (5.1%, a difference of 0.050%), Immigrants from Bulgaria (5.1%, a difference of 0.050%), Immigrants from Jordan (5.1%, a difference of 0.10%), and Carpatho Rusyn (5.1%, a difference of 0.13%).
DemographicsRating | RankUnemployment Among Ages 65 to 74 years
Immigrants | Kazakhstan
99.7
/100
|
#51
Exceptional
5.1%
Europeans
99.6
/100
|
#52
Exceptional
5.1%
Immigrants | Ethiopia
99.6
/100
|
#53
Exceptional
5.1%
Immigrants | Nicaragua
99.6
/100
|
#54
Exceptional
5.1%
Carpatho Rusyns
99.6
/100
|
#55
Exceptional
5.1%
Swedes
99.5
/100
|
#56
Exceptional
5.1%
Croatians
99.5
/100
|
#57
Exceptional
5.1%
Germans
99.5
/100
|
#58
Exceptional
5.1%
Immigrants | Bulgaria
99.4
/100
|
#59
Exceptional
5.1%
Immigrants | Jordan
99.4
/100
|
#60
Exceptional
5.1%
Immigrants | Taiwan
99.4
/100
|
#61
Exceptional
5.1%
Nicaraguans
99.4
/100
|
#62
Exceptional
5.1%
Kiowa
99.3
/100
|
#63
Exceptional
5.1%
Immigrants | Moldova
99.3
/100
|
#64
Exceptional
5.1%
Bolivians
99.3
/100
|
#65
Exceptional
5.1%