Cajun vs Vietnamese Unemployment Among Seniors over 65 years
COMPARE
Cajun
Vietnamese
Unemployment Among Seniors over 65 years
Unemployment Among Seniors over 65 years Comparison
Cajuns
Vietnamese
5.2%
UNEMPLOYMENT AMONG SENIORS OVER 65 YEARS
8.5/ 100
METRIC RATING
216th/ 347
METRIC RANK
5.7%
UNEMPLOYMENT AMONG SENIORS OVER 65 YEARS
0.0/ 100
METRIC RATING
318th/ 347
METRIC RANK
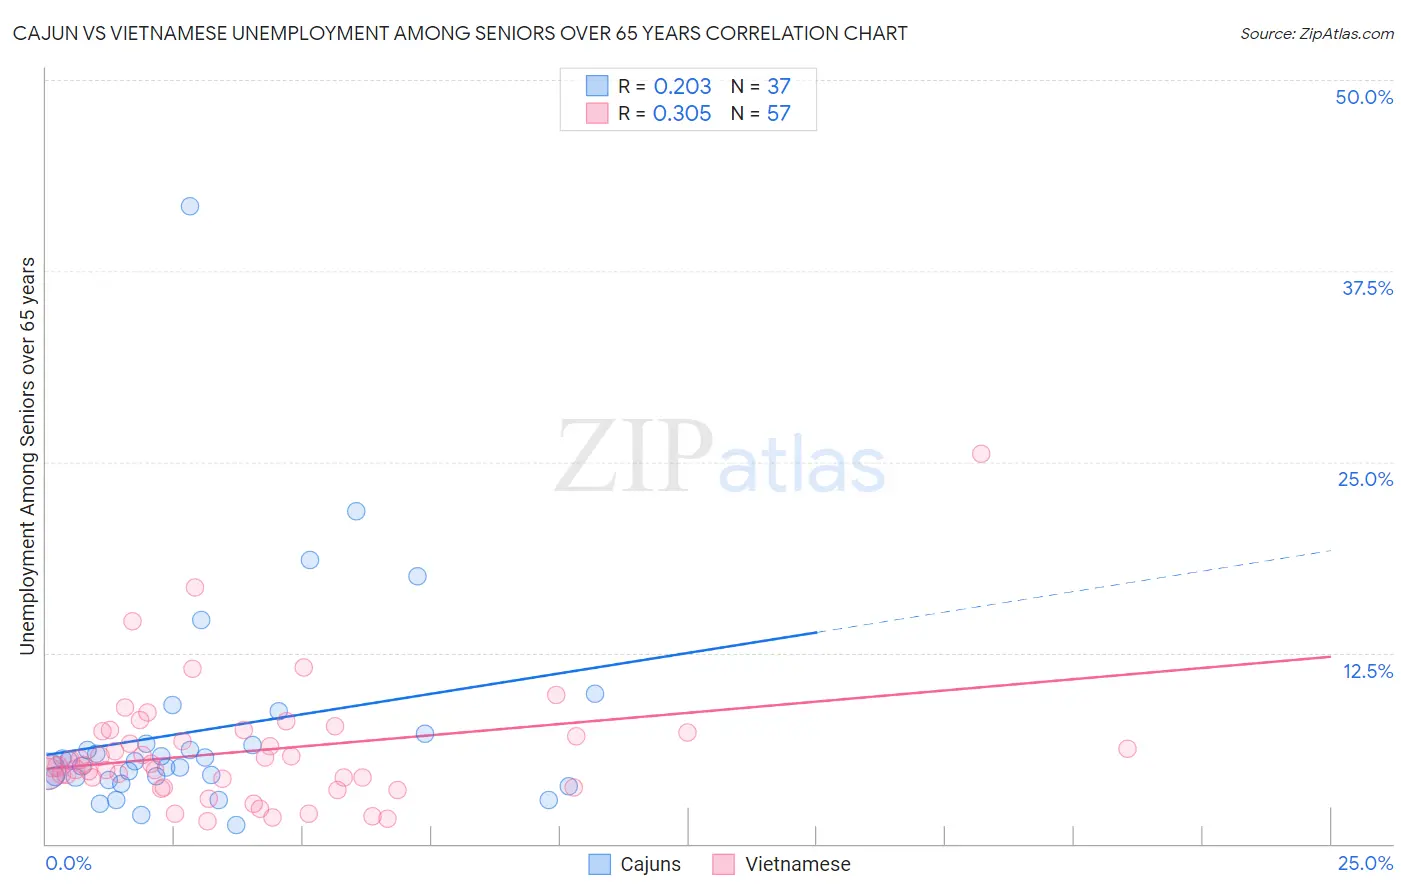
Cajun vs Vietnamese Unemployment Among Seniors over 65 years Correlation Chart
The statistical analysis conducted on geographies consisting of 139,296,025 people shows a weak positive correlation between the proportion of Cajuns and unemployment rate amomg seniors over the age of 65 in the United States with a correlation coefficient (R) of 0.203 and weighted average of 5.2%. Similarly, the statistical analysis conducted on geographies consisting of 164,265,212 people shows a mild positive correlation between the proportion of Vietnamese and unemployment rate amomg seniors over the age of 65 in the United States with a correlation coefficient (R) of 0.305 and weighted average of 5.7%, a difference of 8.8%.
Unemployment Among Seniors over 65 years Correlation Summary
| Measurement | Cajun | Vietnamese |
| Minimum | 1.2% | 1.5% |
| Maximum | 41.7% | 25.5% |
| Range | 40.5% | 24.0% |
| Mean | 7.5% | 6.0% |
| Median | 5.4% | 5.2% |
| Interquartile 25% (IQ1) | 4.3% | 4.0% |
| Interquartile 75% (IQ3) | 6.9% | 7.3% |
| Interquartile Range (IQR) | 2.6% | 3.4% |
| Standard Deviation (Sample) | 7.4% | 4.0% |
| Standard Deviation (Population) | 7.3% | 3.9% |
Similar Demographics by Unemployment Among Seniors over 65 years
Demographics Similar to Cajuns by Unemployment Among Seniors over 65 years
In terms of unemployment among seniors over 65 years, the demographic groups most similar to Cajuns are Immigrants from Fiji (5.2%, a difference of 0.0%), Italian (5.2%, a difference of 0.030%), Albanian (5.2%, a difference of 0.050%), Immigrants from Uruguay (5.2%, a difference of 0.080%), and Spaniard (5.2%, a difference of 0.13%).
| Demographics | Rating | Rank | Unemployment Among Seniors over 65 years |
| Alsatians | 11.4 /100 | #209 | Poor 5.2% |
| Immigrants | Uzbekistan | 10.7 /100 | #210 | Poor 5.2% |
| Africans | 10.4 /100 | #211 | Poor 5.2% |
| Immigrants | Honduras | 10.2 /100 | #212 | Poor 5.2% |
| Immigrants | Uruguay | 9.3 /100 | #213 | Tragic 5.2% |
| Albanians | 9.1 /100 | #214 | Tragic 5.2% |
| Immigrants | Fiji | 8.6 /100 | #215 | Tragic 5.2% |
| Cajuns | 8.5 /100 | #216 | Tragic 5.2% |
| Italians | 8.3 /100 | #217 | Tragic 5.2% |
| Spaniards | 7.4 /100 | #218 | Tragic 5.2% |
| Dutch West Indians | 6.9 /100 | #219 | Tragic 5.3% |
| Egyptians | 6.4 /100 | #220 | Tragic 5.3% |
| Arapaho | 6.3 /100 | #221 | Tragic 5.3% |
| Israelis | 6.2 /100 | #222 | Tragic 5.3% |
| Cree | 5.8 /100 | #223 | Tragic 5.3% |
Demographics Similar to Vietnamese by Unemployment Among Seniors over 65 years
In terms of unemployment among seniors over 65 years, the demographic groups most similar to Vietnamese are Immigrants from Bangladesh (5.7%, a difference of 0.22%), Immigrants from Bahamas (5.7%, a difference of 0.32%), Immigrants from Mexico (5.7%, a difference of 0.38%), Immigrants from Central America (5.7%, a difference of 0.43%), and Immigrants from El Salvador (5.7%, a difference of 0.62%).
| Demographics | Rating | Rank | Unemployment Among Seniors over 65 years |
| Immigrants | Guyana | 0.0 /100 | #311 | Tragic 5.6% |
| Immigrants | Ecuador | 0.0 /100 | #312 | Tragic 5.6% |
| Barbadians | 0.0 /100 | #313 | Tragic 5.6% |
| Delaware | 0.0 /100 | #314 | Tragic 5.7% |
| Immigrants | El Salvador | 0.0 /100 | #315 | Tragic 5.7% |
| Immigrants | Central America | 0.0 /100 | #316 | Tragic 5.7% |
| Immigrants | Bahamas | 0.0 /100 | #317 | Tragic 5.7% |
| Vietnamese | 0.0 /100 | #318 | Tragic 5.7% |
| Immigrants | Bangladesh | 0.0 /100 | #319 | Tragic 5.7% |
| Immigrants | Mexico | 0.0 /100 | #320 | Tragic 5.7% |
| British West Indians | 0.0 /100 | #321 | Tragic 5.8% |
| Natives/Alaskans | 0.0 /100 | #322 | Tragic 5.8% |
| Immigrants | Dominica | 0.0 /100 | #323 | Tragic 5.8% |
| Yuman | 0.0 /100 | #324 | Tragic 5.8% |
| Inupiat | 0.0 /100 | #325 | Tragic 5.8% |