Burmese vs European Unemployment Among Seniors over 75 years
COMPARE
Burmese
European
Unemployment Among Seniors over 75 years
Unemployment Among Seniors over 75 years Comparison
Burmese
Europeans
8.2%
UNEMPLOYMENT AMONG SENIORS OVER 75 YEARS
99.2/ 100
METRIC RATING
99th/ 347
METRIC RANK
9.7%
UNEMPLOYMENT AMONG SENIORS OVER 75 YEARS
0.0/ 100
METRIC RATING
284th/ 347
METRIC RANK
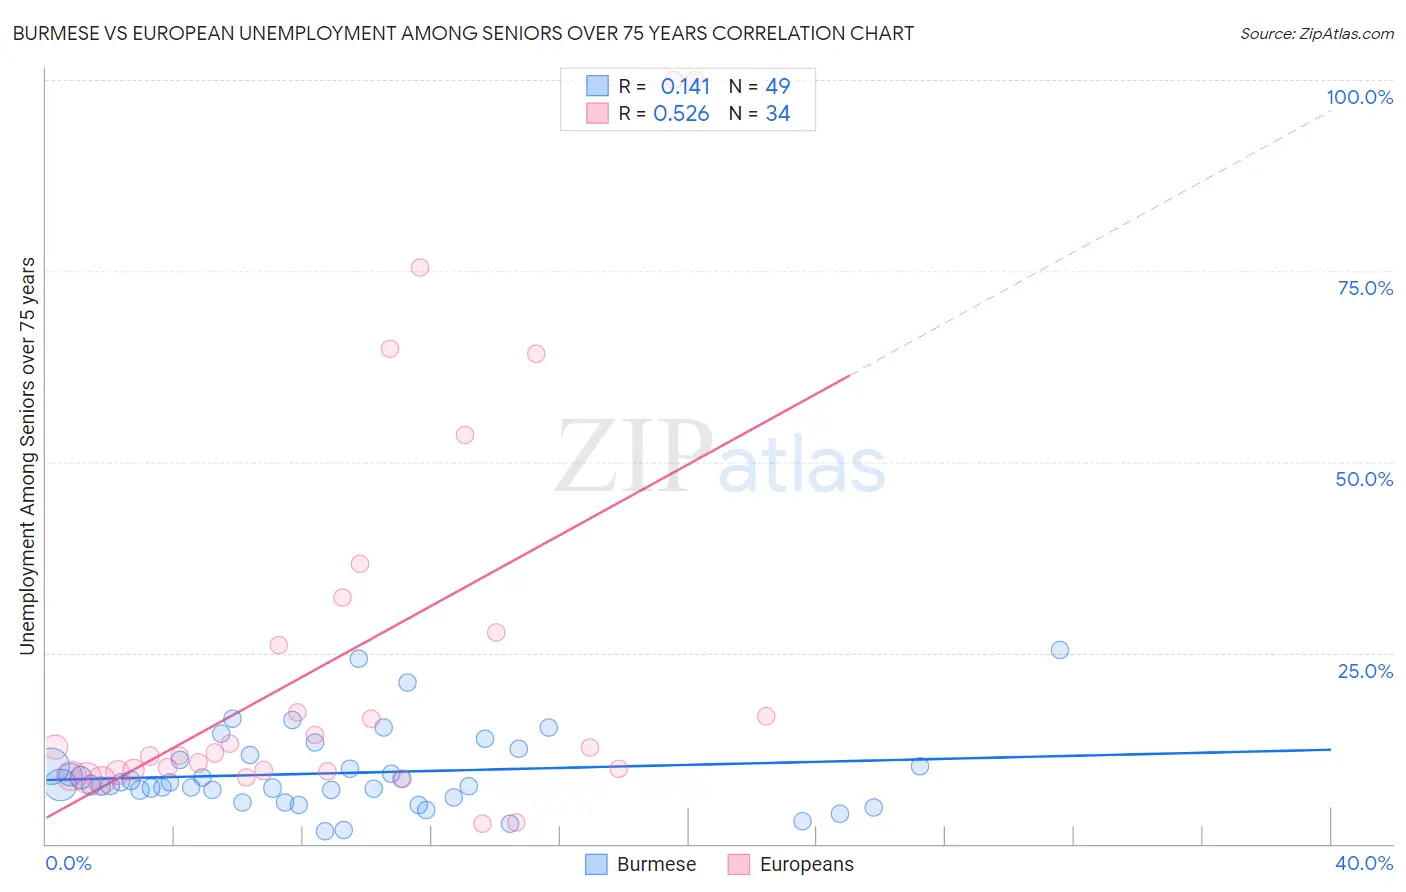
Burmese vs European Unemployment Among Seniors over 75 years Correlation Chart
The statistical analysis conducted on geographies consisting of 219,115,538 people shows a poor positive correlation between the proportion of Burmese and unemployment rate among seniors over the age of 75 in the United States with a correlation coefficient (R) of 0.141 and weighted average of 8.2%. Similarly, the statistical analysis conducted on geographies consisting of 233,542,960 people shows a substantial positive correlation between the proportion of Europeans and unemployment rate among seniors over the age of 75 in the United States with a correlation coefficient (R) of 0.526 and weighted average of 9.7%, a difference of 18.2%.
Unemployment Among Seniors over 75 years Correlation Summary
| Measurement | Burmese | European |
| Minimum | 1.6% | 2.6% |
| Maximum | 25.3% | 100.0% |
| Range | 23.7% | 97.4% |
| Mean | 9.3% | 24.6% |
| Median | 7.7% | 12.2% |
| Interquartile 25% (IQ1) | 6.5% | 9.6% |
| Interquartile 75% (IQ3) | 11.3% | 27.7% |
| Interquartile Range (IQR) | 4.8% | 18.1% |
| Standard Deviation (Sample) | 5.1% | 26.5% |
| Standard Deviation (Population) | 5.1% | 26.1% |
Similar Demographics by Unemployment Among Seniors over 75 years
Demographics Similar to Burmese by Unemployment Among Seniors over 75 years
In terms of unemployment among seniors over 75 years, the demographic groups most similar to Burmese are Immigrants from Kazakhstan (8.2%, a difference of 0.010%), Immigrants from Serbia (8.2%, a difference of 0.050%), Immigrants from Northern Africa (8.2%, a difference of 0.090%), Immigrants from Sri Lanka (8.2%, a difference of 0.14%), and Immigrants from Panama (8.2%, a difference of 0.15%).
| Demographics | Rating | Rank | Unemployment Among Seniors over 75 years |
| Venezuelans | 99.5 /100 | #92 | Exceptional 8.1% |
| Immigrants | Netherlands | 99.5 /100 | #93 | Exceptional 8.1% |
| Immigrants | Ireland | 99.4 /100 | #94 | Exceptional 8.1% |
| Nicaraguans | 99.3 /100 | #95 | Exceptional 8.2% |
| Immigrants | Belgium | 99.3 /100 | #96 | Exceptional 8.2% |
| Immigrants | Sri Lanka | 99.3 /100 | #97 | Exceptional 8.2% |
| Immigrants | Northern Africa | 99.3 /100 | #98 | Exceptional 8.2% |
| Burmese | 99.2 /100 | #99 | Exceptional 8.2% |
| Immigrants | Kazakhstan | 99.2 /100 | #100 | Exceptional 8.2% |
| Immigrants | Serbia | 99.2 /100 | #101 | Exceptional 8.2% |
| Immigrants | Panama | 99.1 /100 | #102 | Exceptional 8.2% |
| South American Indians | 99.1 /100 | #103 | Exceptional 8.2% |
| Immigrants | South Central Asia | 99.0 /100 | #104 | Exceptional 8.2% |
| Immigrants | Caribbean | 99.0 /100 | #105 | Exceptional 8.2% |
| Immigrants | Honduras | 99.0 /100 | #106 | Exceptional 8.2% |
Demographics Similar to Europeans by Unemployment Among Seniors over 75 years
In terms of unemployment among seniors over 75 years, the demographic groups most similar to Europeans are Carpatho Rusyn (9.7%, a difference of 0.030%), Nigerian (9.7%, a difference of 0.090%), Danish (9.7%, a difference of 0.20%), Immigrants from Nigeria (9.6%, a difference of 0.21%), and Macedonian (9.6%, a difference of 0.25%).
| Demographics | Rating | Rank | Unemployment Among Seniors over 75 years |
| Swiss | 0.1 /100 | #277 | Tragic 9.5% |
| Immigrants | Senegal | 0.1 /100 | #278 | Tragic 9.6% |
| British | 0.1 /100 | #279 | Tragic 9.6% |
| Croatians | 0.1 /100 | #280 | Tragic 9.6% |
| Bangladeshis | 0.1 /100 | #281 | Tragic 9.6% |
| Macedonians | 0.0 /100 | #282 | Tragic 9.6% |
| Immigrants | Nigeria | 0.0 /100 | #283 | Tragic 9.6% |
| Europeans | 0.0 /100 | #284 | Tragic 9.7% |
| Carpatho Rusyns | 0.0 /100 | #285 | Tragic 9.7% |
| Nigerians | 0.0 /100 | #286 | Tragic 9.7% |
| Danes | 0.0 /100 | #287 | Tragic 9.7% |
| Canadians | 0.0 /100 | #288 | Tragic 9.7% |
| Czechs | 0.0 /100 | #289 | Tragic 9.7% |
| Sioux | 0.0 /100 | #290 | Tragic 9.7% |
| Scandinavians | 0.0 /100 | #291 | Tragic 9.7% |