Bulgarian vs Immigrants from Grenada Unemployment Among Youth under 25 years
COMPARE
Bulgarian
Immigrants from Grenada
Unemployment Among Youth under 25 years
Unemployment Among Youth under 25 years Comparison
Bulgarians
Immigrants from Grenada
10.9%
UNEMPLOYMENT AMONG YOUTH UNDER 25 YEARS
99.6/ 100
METRIC RATING
45th/ 347
METRIC RANK
15.8%
UNEMPLOYMENT AMONG YOUTH UNDER 25 YEARS
0.0/ 100
METRIC RATING
332nd/ 347
METRIC RANK
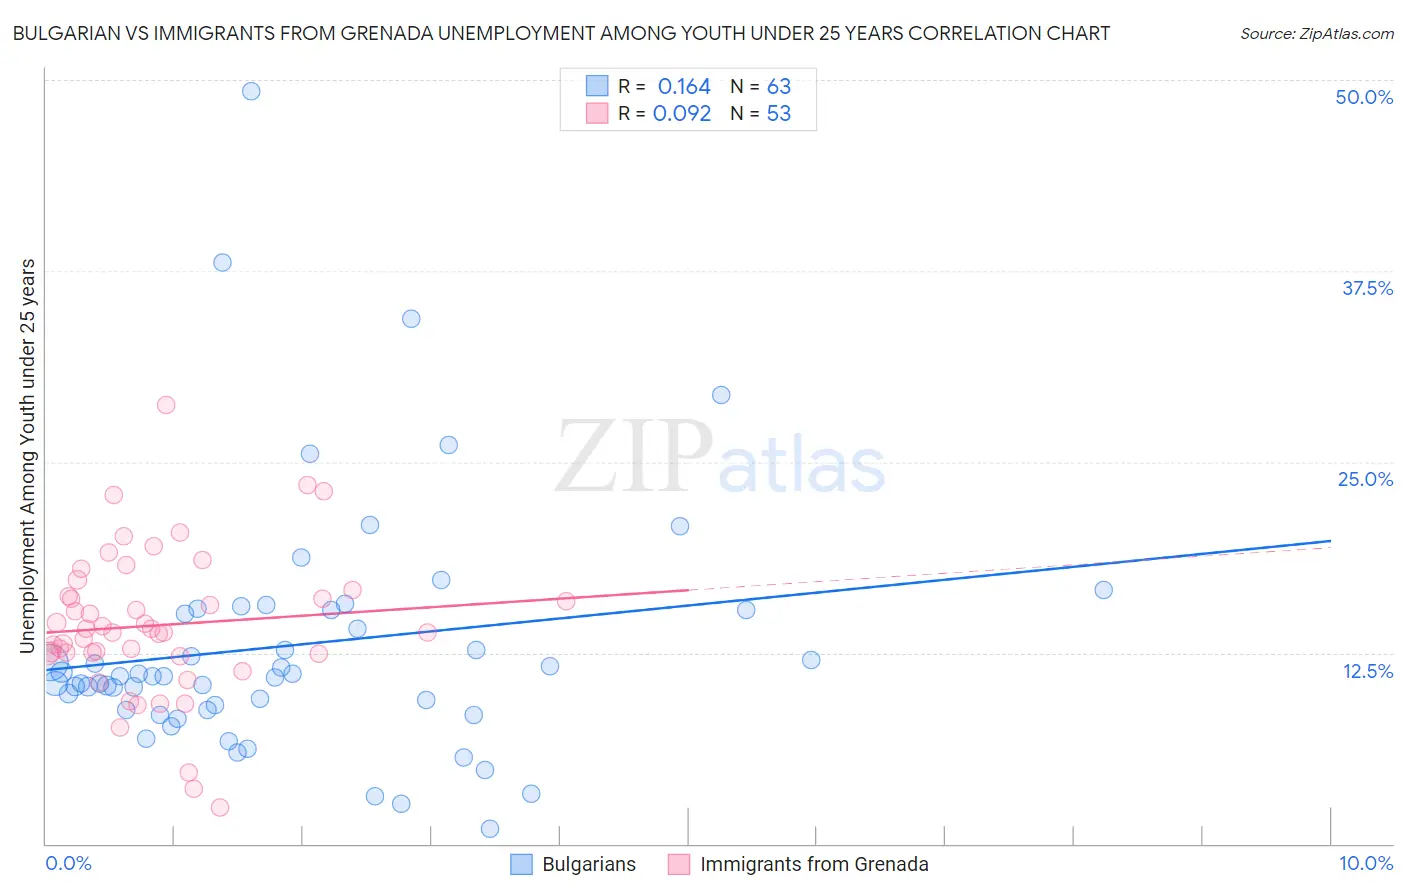
Bulgarian vs Immigrants from Grenada Unemployment Among Youth under 25 years Correlation Chart
The statistical analysis conducted on geographies consisting of 204,435,846 people shows a poor positive correlation between the proportion of Bulgarians and unemployment rate among youth under the age of 25 in the United States with a correlation coefficient (R) of 0.164 and weighted average of 10.9%. Similarly, the statistical analysis conducted on geographies consisting of 67,030,979 people shows a slight positive correlation between the proportion of Immigrants from Grenada and unemployment rate among youth under the age of 25 in the United States with a correlation coefficient (R) of 0.092 and weighted average of 15.8%, a difference of 44.7%.
Unemployment Among Youth under 25 years Correlation Summary
| Measurement | Bulgarian | Immigrants from Grenada |
| Minimum | 1.0% | 2.4% |
| Maximum | 49.3% | 28.8% |
| Range | 48.3% | 26.4% |
| Mean | 13.0% | 14.3% |
| Median | 11.0% | 13.8% |
| Interquartile 25% (IQ1) | 8.8% | 12.4% |
| Interquartile 75% (IQ3) | 15.3% | 16.4% |
| Interquartile Range (IQR) | 6.5% | 4.0% |
| Standard Deviation (Sample) | 8.3% | 4.8% |
| Standard Deviation (Population) | 8.2% | 4.8% |
Similar Demographics by Unemployment Among Youth under 25 years
Demographics Similar to Bulgarians by Unemployment Among Youth under 25 years
In terms of unemployment among youth under 25 years, the demographic groups most similar to Bulgarians are Tongan (10.9%, a difference of 0.040%), Australian (10.9%, a difference of 0.080%), Welsh (10.9%, a difference of 0.10%), British (10.9%, a difference of 0.13%), and Cambodian (10.9%, a difference of 0.38%).
| Demographics | Rating | Rank | Unemployment Among Youth under 25 years |
| Immigrants | Congo | 99.8 /100 | #38 | Exceptional 10.9% |
| Immigrants | Zaire | 99.8 /100 | #39 | Exceptional 10.9% |
| Scottish | 99.8 /100 | #40 | Exceptional 10.9% |
| Croatians | 99.8 /100 | #41 | Exceptional 10.9% |
| Cambodians | 99.7 /100 | #42 | Exceptional 10.9% |
| British | 99.7 /100 | #43 | Exceptional 10.9% |
| Welsh | 99.7 /100 | #44 | Exceptional 10.9% |
| Bulgarians | 99.6 /100 | #45 | Exceptional 10.9% |
| Tongans | 99.6 /100 | #46 | Exceptional 10.9% |
| Australians | 99.6 /100 | #47 | Exceptional 10.9% |
| Poles | 99.3 /100 | #48 | Exceptional 11.0% |
| Thais | 99.3 /100 | #49 | Exceptional 11.0% |
| Czechoslovakians | 99.2 /100 | #50 | Exceptional 11.0% |
| Serbians | 99.0 /100 | #51 | Exceptional 11.0% |
| Latvians | 99.0 /100 | #52 | Exceptional 11.0% |
Demographics Similar to Immigrants from Grenada by Unemployment Among Youth under 25 years
In terms of unemployment among youth under 25 years, the demographic groups most similar to Immigrants from Grenada are Guyanese (15.9%, a difference of 0.46%), Dominican (15.7%, a difference of 0.67%), Immigrants from Guyana (15.9%, a difference of 0.71%), Yakama (15.6%, a difference of 1.5%), and Immigrants from Yemen (15.6%, a difference of 1.5%).
| Demographics | Rating | Rank | Unemployment Among Youth under 25 years |
| Alaska Natives | 0.0 /100 | #325 | Tragic 14.9% |
| Immigrants | Barbados | 0.0 /100 | #326 | Tragic 15.2% |
| British West Indians | 0.0 /100 | #327 | Tragic 15.5% |
| Immigrants | Dominican Republic | 0.0 /100 | #328 | Tragic 15.6% |
| Immigrants | Yemen | 0.0 /100 | #329 | Tragic 15.6% |
| Yakama | 0.0 /100 | #330 | Tragic 15.6% |
| Dominicans | 0.0 /100 | #331 | Tragic 15.7% |
| Immigrants | Grenada | 0.0 /100 | #332 | Tragic 15.8% |
| Guyanese | 0.0 /100 | #333 | Tragic 15.9% |
| Immigrants | Guyana | 0.0 /100 | #334 | Tragic 15.9% |
| Immigrants | St. Vincent and the Grenadines | 0.0 /100 | #335 | Tragic 16.1% |
| Pima | 0.0 /100 | #336 | Tragic 16.2% |
| Arapaho | 0.0 /100 | #337 | Tragic 16.3% |
| Yuman | 0.0 /100 | #338 | Tragic 16.3% |
| Tsimshian | 0.0 /100 | #339 | Tragic 16.5% |