Bulgarian vs Albanian Unemployment Among Ages 25 to 29 years
COMPARE
Bulgarian
Albanian
Unemployment Among Ages 25 to 29 years
Unemployment Among Ages 25 to 29 years Comparison
Bulgarians
Albanians
6.1%
UNEMPLOYMENT AMONG AGES 25 TO 29 YEARS
99.7/ 100
METRIC RATING
30th/ 347
METRIC RANK
6.6%
UNEMPLOYMENT AMONG AGES 25 TO 29 YEARS
53.5/ 100
METRIC RATING
170th/ 347
METRIC RANK
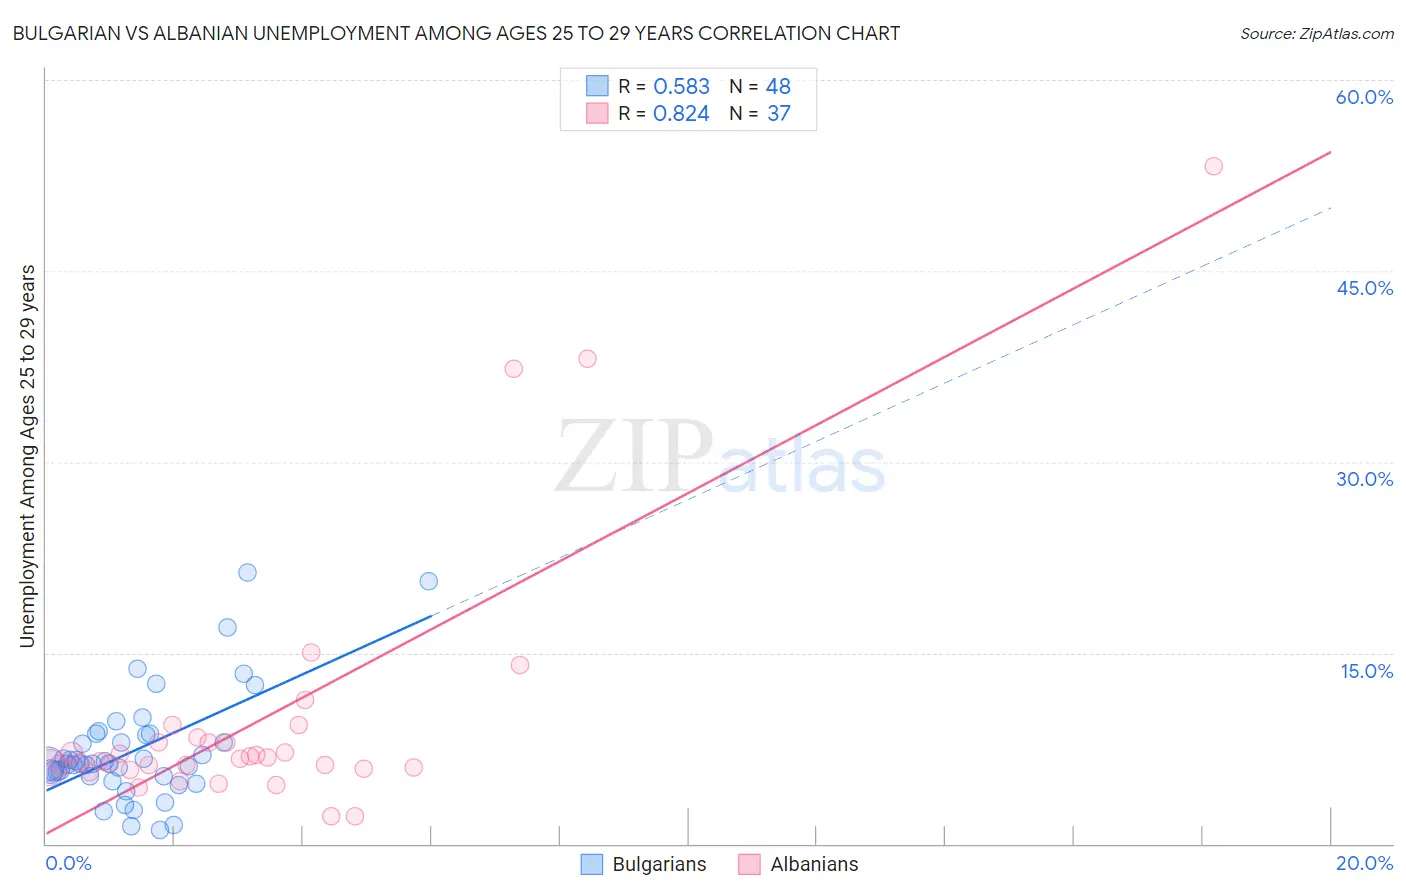
Bulgarian vs Albanian Unemployment Among Ages 25 to 29 years Correlation Chart
The statistical analysis conducted on geographies consisting of 199,451,954 people shows a substantial positive correlation between the proportion of Bulgarians and unemployment rate among population between the ages 25 and 29 in the United States with a correlation coefficient (R) of 0.583 and weighted average of 6.1%. Similarly, the statistical analysis conducted on geographies consisting of 187,118,297 people shows a very strong positive correlation between the proportion of Albanians and unemployment rate among population between the ages 25 and 29 in the United States with a correlation coefficient (R) of 0.824 and weighted average of 6.6%, a difference of 9.5%.
Unemployment Among Ages 25 to 29 years Correlation Summary
| Measurement | Bulgarian | Albanian |
| Minimum | 1.1% | 2.2% |
| Maximum | 21.3% | 53.2% |
| Range | 20.2% | 51.0% |
| Mean | 7.3% | 9.9% |
| Median | 6.3% | 6.6% |
| Interquartile 25% (IQ1) | 5.3% | 5.9% |
| Interquartile 75% (IQ3) | 8.6% | 8.2% |
| Interquartile Range (IQR) | 3.3% | 2.2% |
| Standard Deviation (Sample) | 4.3% | 10.5% |
| Standard Deviation (Population) | 4.2% | 10.3% |
Similar Demographics by Unemployment Among Ages 25 to 29 years
Demographics Similar to Bulgarians by Unemployment Among Ages 25 to 29 years
In terms of unemployment among ages 25 to 29 years, the demographic groups most similar to Bulgarians are Filipino (6.1%, a difference of 0.090%), Immigrants from South Central Asia (6.1%, a difference of 0.11%), Danish (6.0%, a difference of 0.29%), Immigrants from Zaire (6.0%, a difference of 0.34%), and Chinese (6.1%, a difference of 0.44%).
| Demographics | Rating | Rank | Unemployment Among Ages 25 to 29 years |
| Immigrants | Venezuela | 99.8 /100 | #23 | Exceptional 6.0% |
| Norwegians | 99.8 /100 | #24 | Exceptional 6.0% |
| New Zealanders | 99.8 /100 | #25 | Exceptional 6.0% |
| Immigrants | Eastern Africa | 99.8 /100 | #26 | Exceptional 6.0% |
| Immigrants | Zaire | 99.7 /100 | #27 | Exceptional 6.0% |
| Danes | 99.7 /100 | #28 | Exceptional 6.0% |
| Immigrants | South Central Asia | 99.7 /100 | #29 | Exceptional 6.1% |
| Bulgarians | 99.7 /100 | #30 | Exceptional 6.1% |
| Filipinos | 99.7 /100 | #31 | Exceptional 6.1% |
| Chinese | 99.6 /100 | #32 | Exceptional 6.1% |
| Yugoslavians | 99.6 /100 | #33 | Exceptional 6.1% |
| Immigrants | Morocco | 99.5 /100 | #34 | Exceptional 6.1% |
| Immigrants | Zimbabwe | 99.5 /100 | #35 | Exceptional 6.1% |
| Taiwanese | 99.5 /100 | #36 | Exceptional 6.1% |
| Immigrants | Serbia | 99.5 /100 | #37 | Exceptional 6.1% |
Demographics Similar to Albanians by Unemployment Among Ages 25 to 29 years
In terms of unemployment among ages 25 to 29 years, the demographic groups most similar to Albanians are South American (6.6%, a difference of 0.060%), Immigrants from Cambodia (6.6%, a difference of 0.060%), Estonian (6.6%, a difference of 0.080%), Immigrants from Canada (6.6%, a difference of 0.090%), and Bangladeshi (6.6%, a difference of 0.12%).
| Demographics | Rating | Rank | Unemployment Among Ages 25 to 29 years |
| Immigrants | Middle Africa | 59.4 /100 | #163 | Average 6.6% |
| Greeks | 58.5 /100 | #164 | Average 6.6% |
| English | 58.0 /100 | #165 | Average 6.6% |
| Immigrants | Northern Europe | 57.3 /100 | #166 | Average 6.6% |
| Immigrants | Canada | 55.0 /100 | #167 | Average 6.6% |
| Estonians | 54.8 /100 | #168 | Average 6.6% |
| South Americans | 54.5 /100 | #169 | Average 6.6% |
| Albanians | 53.5 /100 | #170 | Average 6.6% |
| Immigrants | Cambodia | 52.6 /100 | #171 | Average 6.6% |
| Bangladeshis | 51.6 /100 | #172 | Average 6.6% |
| Russians | 51.3 /100 | #173 | Average 6.6% |
| Immigrants | North America | 50.0 /100 | #174 | Average 6.6% |
| Immigrants | South Eastern Asia | 49.1 /100 | #175 | Average 6.7% |
| Osage | 48.1 /100 | #176 | Average 6.7% |
| Immigrants | Israel | 47.8 /100 | #177 | Average 6.7% |