British West Indian vs Taiwanese Unemployment Among Ages 60 to 64 years
COMPARE
British West Indian
Taiwanese
Unemployment Among Ages 60 to 64 years
Unemployment Among Ages 60 to 64 years Comparison
British West Indians
Taiwanese
5.5%
UNEMPLOYMENT AMONG AGES 60 TO 64 YEARS
0.0/ 100
METRIC RATING
310th/ 347
METRIC RANK
5.3%
UNEMPLOYMENT AMONG AGES 60 TO 64 YEARS
0.0/ 100
METRIC RATING
284th/ 347
METRIC RANK
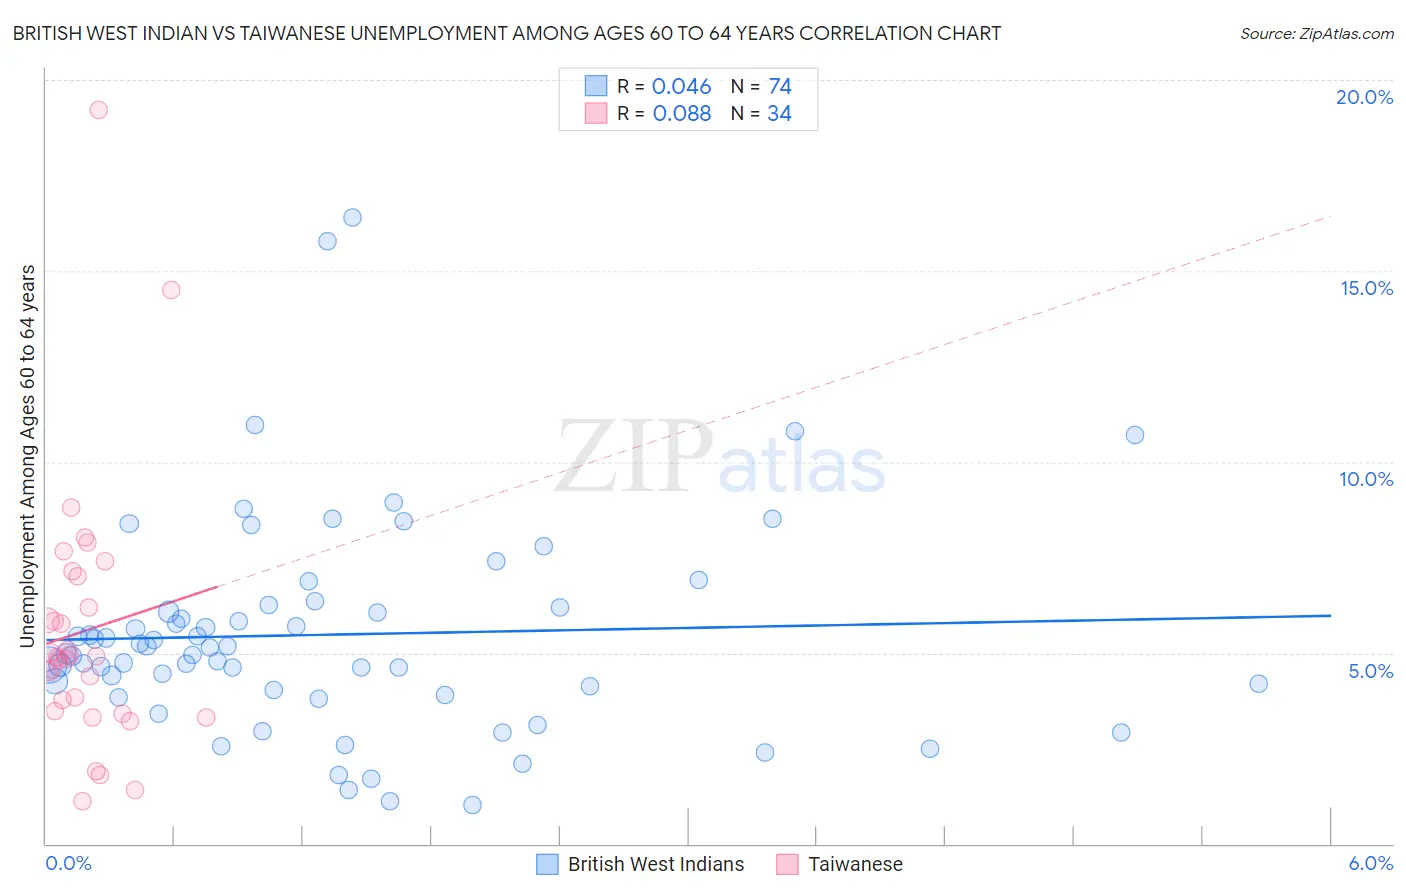
British West Indian vs Taiwanese Unemployment Among Ages 60 to 64 years Correlation Chart
The statistical analysis conducted on geographies consisting of 146,208,505 people shows no correlation between the proportion of British West Indians and unemployment rate among population between the ages 60 and 64 in the United States with a correlation coefficient (R) of 0.046 and weighted average of 5.5%. Similarly, the statistical analysis conducted on geographies consisting of 31,456,582 people shows a slight positive correlation between the proportion of Taiwanese and unemployment rate among population between the ages 60 and 64 in the United States with a correlation coefficient (R) of 0.088 and weighted average of 5.3%, a difference of 3.7%.
Unemployment Among Ages 60 to 64 years Correlation Summary
| Measurement | British West Indian | Taiwanese |
| Minimum | 1.0% | 1.1% |
| Maximum | 16.4% | 19.2% |
| Range | 15.4% | 18.1% |
| Mean | 5.5% | 5.6% |
| Median | 5.1% | 4.9% |
| Interquartile 25% (IQ1) | 4.0% | 3.5% |
| Interquartile 75% (IQ3) | 6.2% | 7.0% |
| Interquartile Range (IQR) | 2.2% | 3.5% |
| Standard Deviation (Sample) | 2.8% | 3.5% |
| Standard Deviation (Population) | 2.8% | 3.4% |
Similar Demographics by Unemployment Among Ages 60 to 64 years
Demographics Similar to British West Indians by Unemployment Among Ages 60 to 64 years
In terms of unemployment among ages 60 to 64 years, the demographic groups most similar to British West Indians are U.S. Virgin Islander (5.5%, a difference of 0.020%), Immigrants from West Indies (5.5%, a difference of 0.20%), Belizean (5.5%, a difference of 0.90%), Soviet Union (5.4%, a difference of 0.92%), and Spanish American Indian (5.4%, a difference of 0.93%).
| Demographics | Rating | Rank | Unemployment Among Ages 60 to 64 years |
| Bahamians | 0.0 /100 | #303 | Tragic 5.4% |
| Immigrants | Mexico | 0.0 /100 | #304 | Tragic 5.4% |
| Cypriots | 0.0 /100 | #305 | Tragic 5.4% |
| Immigrants | Dominica | 0.0 /100 | #306 | Tragic 5.4% |
| Immigrants | Guyana | 0.0 /100 | #307 | Tragic 5.4% |
| Spanish American Indians | 0.0 /100 | #308 | Tragic 5.4% |
| Soviet Union | 0.0 /100 | #309 | Tragic 5.4% |
| British West Indians | 0.0 /100 | #310 | Tragic 5.5% |
| U.S. Virgin Islanders | 0.0 /100 | #311 | Tragic 5.5% |
| Immigrants | West Indies | 0.0 /100 | #312 | Tragic 5.5% |
| Belizeans | 0.0 /100 | #313 | Tragic 5.5% |
| Guyanese | 0.0 /100 | #314 | Tragic 5.5% |
| Cree | 0.0 /100 | #315 | Tragic 5.6% |
| Cheyenne | 0.0 /100 | #316 | Tragic 5.6% |
| Shoshone | 0.0 /100 | #317 | Tragic 5.7% |
Demographics Similar to Taiwanese by Unemployment Among Ages 60 to 64 years
In terms of unemployment among ages 60 to 64 years, the demographic groups most similar to Taiwanese are Immigrants from Guatemala (5.3%, a difference of 0.090%), West Indian (5.3%, a difference of 0.13%), Mexican American Indian (5.3%, a difference of 0.24%), Salvadoran (5.3%, a difference of 0.28%), and Trinidadian and Tobagonian (5.3%, a difference of 0.46%).
| Demographics | Rating | Rank | Unemployment Among Ages 60 to 64 years |
| Immigrants | Caribbean | 0.0 /100 | #277 | Tragic 5.2% |
| Guatemalans | 0.0 /100 | #278 | Tragic 5.2% |
| Nepalese | 0.0 /100 | #279 | Tragic 5.2% |
| French American Indians | 0.0 /100 | #280 | Tragic 5.2% |
| Immigrants | Haiti | 0.0 /100 | #281 | Tragic 5.2% |
| Mexicans | 0.0 /100 | #282 | Tragic 5.2% |
| Immigrants | Guatemala | 0.0 /100 | #283 | Tragic 5.3% |
| Taiwanese | 0.0 /100 | #284 | Tragic 5.3% |
| West Indians | 0.0 /100 | #285 | Tragic 5.3% |
| Mexican American Indians | 0.0 /100 | #286 | Tragic 5.3% |
| Salvadorans | 0.0 /100 | #287 | Tragic 5.3% |
| Trinidadians and Tobagonians | 0.0 /100 | #288 | Tragic 5.3% |
| Spanish Americans | 0.0 /100 | #289 | Tragic 5.3% |
| Immigrants | Trinidad and Tobago | 0.0 /100 | #290 | Tragic 5.3% |
| Hispanics or Latinos | 0.0 /100 | #291 | Tragic 5.3% |