British West Indian vs Cherokee Unemployment Among Seniors over 65 years
COMPARE
British West Indian
Cherokee
Unemployment Among Seniors over 65 years
Unemployment Among Seniors over 65 years Comparison
British West Indians
Cherokee
5.8%
UNEMPLOYMENT AMONG SENIORS OVER 65 YEARS
0.0/ 100
METRIC RATING
321st/ 347
METRIC RANK
5.1%
UNEMPLOYMENT AMONG SENIORS OVER 65 YEARS
81.6/ 100
METRIC RATING
141st/ 347
METRIC RANK
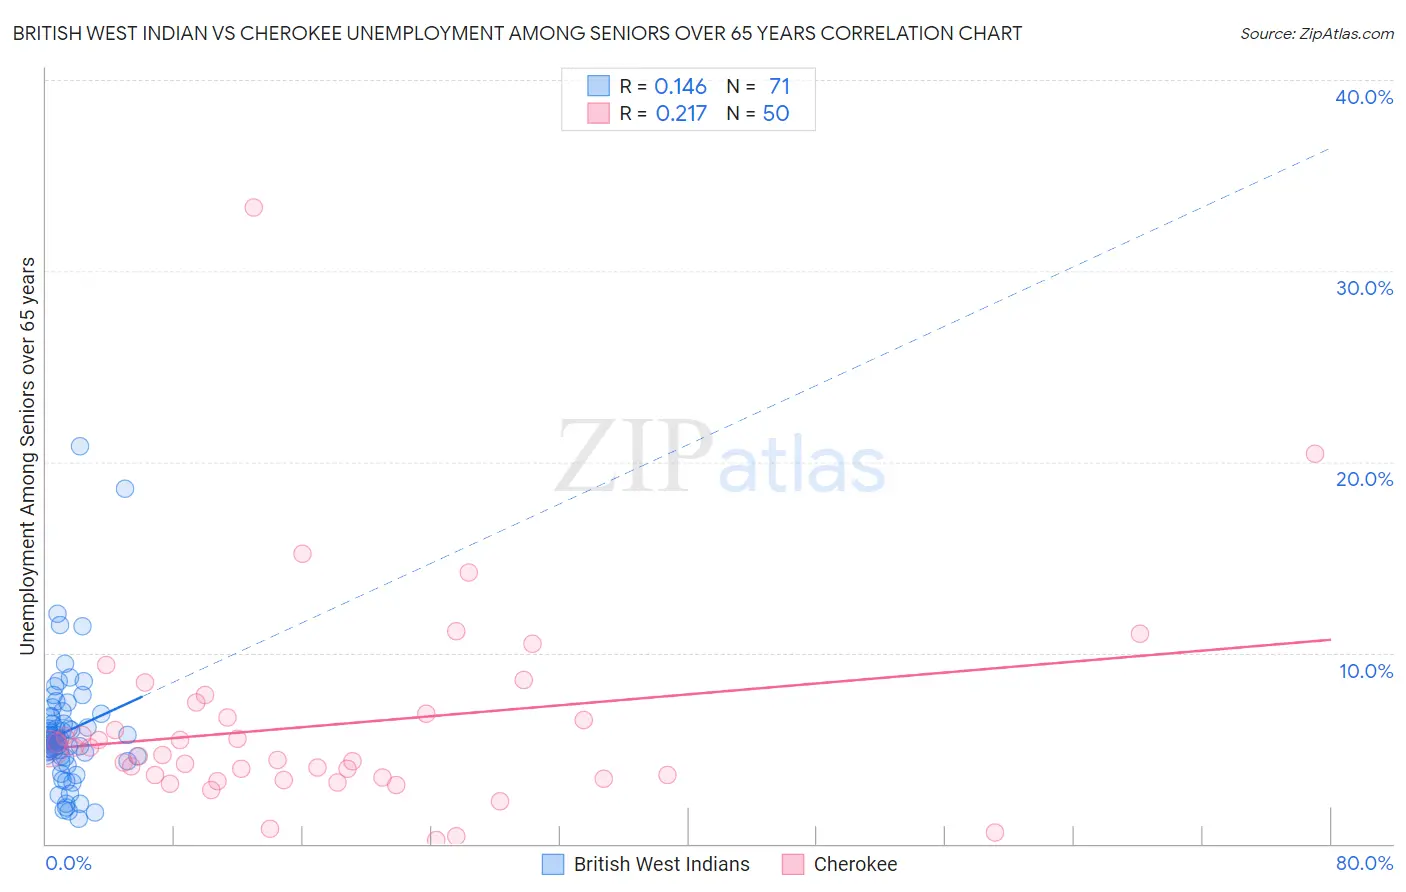
British West Indian vs Cherokee Unemployment Among Seniors over 65 years Correlation Chart
The statistical analysis conducted on geographies consisting of 146,106,387 people shows a poor positive correlation between the proportion of British West Indians and unemployment rate amomg seniors over the age of 65 in the United States with a correlation coefficient (R) of 0.146 and weighted average of 5.8%. Similarly, the statistical analysis conducted on geographies consisting of 416,373,281 people shows a weak positive correlation between the proportion of Cherokee and unemployment rate amomg seniors over the age of 65 in the United States with a correlation coefficient (R) of 0.217 and weighted average of 5.1%, a difference of 13.4%.
Unemployment Among Seniors over 65 years Correlation Summary
| Measurement | British West Indian | Cherokee |
| Minimum | 1.3% | 0.20% |
| Maximum | 20.8% | 33.3% |
| Range | 19.5% | 33.1% |
| Mean | 5.9% | 6.2% |
| Median | 5.5% | 4.8% |
| Interquartile 25% (IQ1) | 4.5% | 3.5% |
| Interquartile 75% (IQ3) | 6.7% | 6.8% |
| Interquartile Range (IQR) | 2.2% | 3.3% |
| Standard Deviation (Sample) | 3.2% | 5.4% |
| Standard Deviation (Population) | 3.2% | 5.4% |
Similar Demographics by Unemployment Among Seniors over 65 years
Demographics Similar to British West Indians by Unemployment Among Seniors over 65 years
In terms of unemployment among seniors over 65 years, the demographic groups most similar to British West Indians are Native/Alaskan (5.8%, a difference of 0.080%), Immigrants from Dominica (5.8%, a difference of 0.42%), Yuman (5.8%, a difference of 0.59%), Immigrants from Mexico (5.7%, a difference of 0.64%), and Immigrants from Bangladesh (5.7%, a difference of 0.80%).
| Demographics | Rating | Rank | Unemployment Among Seniors over 65 years |
| Delaware | 0.0 /100 | #314 | Tragic 5.7% |
| Immigrants | El Salvador | 0.0 /100 | #315 | Tragic 5.7% |
| Immigrants | Central America | 0.0 /100 | #316 | Tragic 5.7% |
| Immigrants | Bahamas | 0.0 /100 | #317 | Tragic 5.7% |
| Vietnamese | 0.0 /100 | #318 | Tragic 5.7% |
| Immigrants | Bangladesh | 0.0 /100 | #319 | Tragic 5.7% |
| Immigrants | Mexico | 0.0 /100 | #320 | Tragic 5.7% |
| British West Indians | 0.0 /100 | #321 | Tragic 5.8% |
| Natives/Alaskans | 0.0 /100 | #322 | Tragic 5.8% |
| Immigrants | Dominica | 0.0 /100 | #323 | Tragic 5.8% |
| Yuman | 0.0 /100 | #324 | Tragic 5.8% |
| Inupiat | 0.0 /100 | #325 | Tragic 5.8% |
| Shoshone | 0.0 /100 | #326 | Tragic 5.9% |
| Bermudans | 0.0 /100 | #327 | Tragic 5.9% |
| Puerto Ricans | 0.0 /100 | #328 | Tragic 5.9% |
Demographics Similar to Cherokee by Unemployment Among Seniors over 65 years
In terms of unemployment among seniors over 65 years, the demographic groups most similar to Cherokee are Immigrants from Indonesia (5.1%, a difference of 0.030%), Senegalese (5.1%, a difference of 0.060%), Polish (5.1%, a difference of 0.070%), Immigrants from Panama (5.1%, a difference of 0.080%), and Immigrants from Chile (5.1%, a difference of 0.080%).
| Demographics | Rating | Rank | Unemployment Among Seniors over 65 years |
| Turks | 84.9 /100 | #134 | Excellent 5.1% |
| Ukrainians | 84.4 /100 | #135 | Excellent 5.1% |
| Whites/Caucasians | 84.4 /100 | #136 | Excellent 5.1% |
| Arabs | 84.3 /100 | #137 | Excellent 5.1% |
| New Zealanders | 83.2 /100 | #138 | Excellent 5.1% |
| Immigrants | Panama | 83.0 /100 | #139 | Excellent 5.1% |
| Immigrants | Chile | 83.0 /100 | #140 | Excellent 5.1% |
| Cherokee | 81.6 /100 | #141 | Excellent 5.1% |
| Immigrants | Indonesia | 81.0 /100 | #142 | Excellent 5.1% |
| Senegalese | 80.4 /100 | #143 | Excellent 5.1% |
| Poles | 80.3 /100 | #144 | Excellent 5.1% |
| Spanish | 78.8 /100 | #145 | Good 5.1% |
| Immigrants | Russia | 78.5 /100 | #146 | Good 5.1% |
| Slovaks | 77.9 /100 | #147 | Good 5.1% |
| Greeks | 77.0 /100 | #148 | Good 5.1% |