British vs Kenyan Unemployment Among Women with Children Under 18 years
COMPARE
British
Kenyan
Unemployment Among Women with Children Under 18 years
Unemployment Among Women with Children Under 18 years Comparison
British
Kenyans
5.0%
UNEMPLOYMENT AMONG WOMEN WITH CHILDREN UNDER 18 YEARS
98.7/ 100
METRIC RATING
47th/ 347
METRIC RANK
5.3%
UNEMPLOYMENT AMONG WOMEN WITH CHILDREN UNDER 18 YEARS
88.2/ 100
METRIC RATING
114th/ 347
METRIC RANK
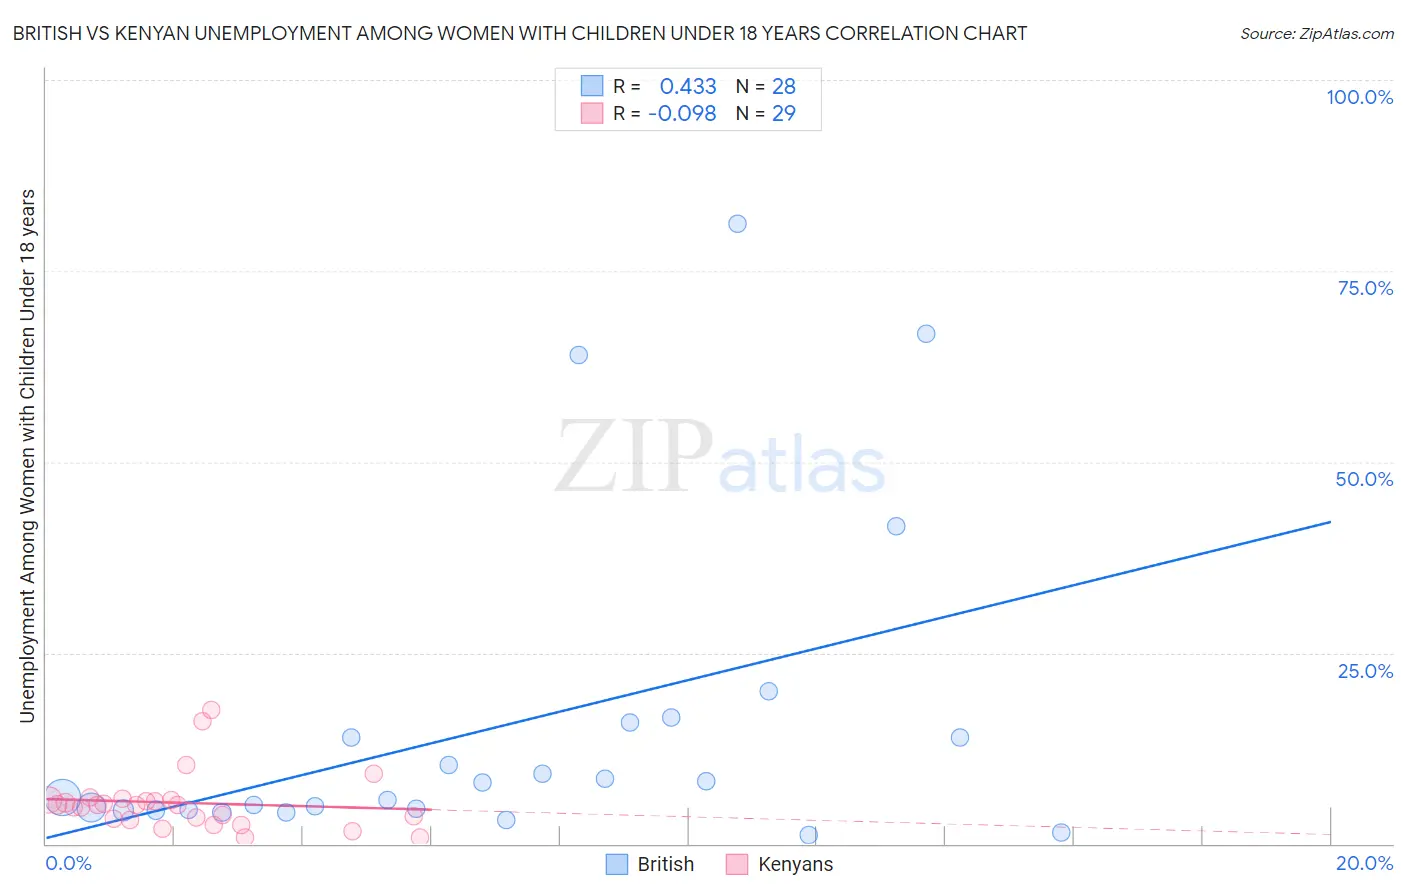
British vs Kenyan Unemployment Among Women with Children Under 18 years Correlation Chart
The statistical analysis conducted on geographies consisting of 489,601,986 people shows a moderate positive correlation between the proportion of British and unemployment rate among women with children under the age of 18 in the United States with a correlation coefficient (R) of 0.433 and weighted average of 5.0%. Similarly, the statistical analysis conducted on geographies consisting of 165,742,176 people shows a slight negative correlation between the proportion of Kenyans and unemployment rate among women with children under the age of 18 in the United States with a correlation coefficient (R) of -0.098 and weighted average of 5.3%, a difference of 4.4%.
Unemployment Among Women with Children Under 18 years Correlation Summary
| Measurement | British | Kenyan |
| Minimum | 1.1% | 0.90% |
| Maximum | 81.2% | 17.5% |
| Range | 80.1% | 16.6% |
| Mean | 15.6% | 5.4% |
| Median | 7.0% | 5.1% |
| Interquartile 25% (IQ1) | 4.5% | 3.2% |
| Interquartile 75% (IQ3) | 14.9% | 5.8% |
| Interquartile Range (IQR) | 10.5% | 2.5% |
| Standard Deviation (Sample) | 21.1% | 3.8% |
| Standard Deviation (Population) | 20.7% | 3.7% |
Similar Demographics by Unemployment Among Women with Children Under 18 years
Demographics Similar to British by Unemployment Among Women with Children Under 18 years
In terms of unemployment among women with children under 18 years, the demographic groups most similar to British are Immigrants from Korea (5.0%, a difference of 0.13%), Northern European (5.0%, a difference of 0.13%), Immigrants from Malaysia (5.0%, a difference of 0.24%), Immigrants from Moldova (5.0%, a difference of 0.32%), and Lithuanian (5.0%, a difference of 0.35%).
| Demographics | Rating | Rank | Unemployment Among Women with Children Under 18 years |
| Greeks | 99.0 /100 | #40 | Exceptional 5.0% |
| Immigrants | Bosnia and Herzegovina | 99.0 /100 | #41 | Exceptional 5.0% |
| Eastern Europeans | 98.9 /100 | #42 | Exceptional 5.0% |
| Turks | 98.9 /100 | #43 | Exceptional 5.0% |
| Immigrants | Moldova | 98.9 /100 | #44 | Exceptional 5.0% |
| Immigrants | Malaysia | 98.8 /100 | #45 | Exceptional 5.0% |
| Immigrants | Korea | 98.7 /100 | #46 | Exceptional 5.0% |
| British | 98.7 /100 | #47 | Exceptional 5.0% |
| Northern Europeans | 98.6 /100 | #48 | Exceptional 5.0% |
| Lithuanians | 98.4 /100 | #49 | Exceptional 5.0% |
| Immigrants | Japan | 98.4 /100 | #50 | Exceptional 5.0% |
| Yugoslavians | 98.3 /100 | #51 | Exceptional 5.1% |
| Immigrants | Nepal | 98.3 /100 | #52 | Exceptional 5.1% |
| Scottish | 98.2 /100 | #53 | Exceptional 5.1% |
| Immigrants | Serbia | 98.2 /100 | #54 | Exceptional 5.1% |
Demographics Similar to Kenyans by Unemployment Among Women with Children Under 18 years
In terms of unemployment among women with children under 18 years, the demographic groups most similar to Kenyans are Hungarian (5.3%, a difference of 0.010%), French (5.2%, a difference of 0.040%), Immigrants from Eastern Europe (5.2%, a difference of 0.050%), Macedonian (5.3%, a difference of 0.080%), and Immigrants from Czechoslovakia (5.2%, a difference of 0.13%).
| Demographics | Rating | Rank | Unemployment Among Women with Children Under 18 years |
| Slavs | 89.8 /100 | #107 | Excellent 5.2% |
| Iranians | 89.7 /100 | #108 | Excellent 5.2% |
| Immigrants | Russia | 89.0 /100 | #109 | Excellent 5.2% |
| Immigrants | Czechoslovakia | 88.9 /100 | #110 | Excellent 5.2% |
| French Canadians | 88.9 /100 | #111 | Excellent 5.2% |
| Immigrants | Eastern Europe | 88.5 /100 | #112 | Excellent 5.2% |
| French | 88.4 /100 | #113 | Excellent 5.2% |
| Kenyans | 88.2 /100 | #114 | Excellent 5.3% |
| Hungarians | 88.1 /100 | #115 | Excellent 5.3% |
| Macedonians | 87.7 /100 | #116 | Excellent 5.3% |
| Canadians | 87.4 /100 | #117 | Excellent 5.3% |
| Immigrants | Europe | 86.7 /100 | #118 | Excellent 5.3% |
| Basques | 86.5 /100 | #119 | Excellent 5.3% |
| Egyptians | 86.4 /100 | #120 | Excellent 5.3% |
| Immigrants | Romania | 85.8 /100 | #121 | Excellent 5.3% |