British vs Immigrants from Jordan Unemployment Among Ages 20 to 24 years

COMPARE

British
Race
Ancestry
AfghanAfricanAlaska NativeAlaskan AthabascanAlbanianAleutAlsatianAmericanApacheArabArapahoArgentineanArmenianAssyrian/Chaldean/SyriacAustralianAustrianBahamianBangladeshiBarbadianBasqueBelgianBelizeanBermudanBhutaneseBlackfeetBolivianBrazilianBritishBritish West IndianBulgarianBurmeseCajunCambodianCanadianCape VerdeanCarpatho RusynCelticCentral AmericanCentral American IndianCherokeeCheyenneChickasawChileanChineseChippewaChoctawColombianColvilleComancheCosta RicanCreeCreekCroatianCrowCubanCypriotCzechCzechoslovakianDanishDelawareDominicanDutchDutch West IndianEastern EuropeanEcuadorianEgyptianEnglishEstonianEthiopianEuropeanFijianFilipinoFinnishFrenchFrench American IndianFrench CanadianGermanGerman RussianGhanaianGreekGuamanian/ChamorroGuatemalanGuyaneseHaitianHmongHonduranHopiHoumaHungarianIcelanderIndian (Asian)IndonesianInupiatIranianIraqiIrishIroquoisIsraeliItalianJamaicanJapaneseJordanianKenyanKiowaKoreanLaotianLatvianLebaneseLiberianLithuanianLumbeeLuxembourgerMacedonianMalaysianMalteseMarshalleseMenomineeMexicanMexican American IndianMongolianMoroccanNative HawaiianNavajoNepaleseNew ZealanderNicaraguanNigerianNorthern EuropeanNorwegianOkinawanOsageOttawaPaiutePakistaniPalestinianPanamanianParaguayanPennsylvania GermanPeruvianPimaPolishPortuguesePotawatomiPuebloPuerto RicanPuget Sound SalishRomanianRussianSalvadoranSamoanScandinavianScotch-IrishScottishSeminoleSenegaleseSerbianShoshoneSierra LeoneanSiouxSlavicSlovakSloveneSomaliSouth AfricanSouth AmericanSouth American IndianSoviet UnionSpaniardSpanishSpanish AmericanSpanish American IndianSri LankanSubsaharan AfricanSudaneseSwedishSwissSyrianTaiwaneseThaiTlingit-HaidaTohono O'OdhamTonganTrinidadian and TobagonianTsimshianTurkishU.S. Virgin IslanderUgandanUkrainianUruguayanUteVenezuelanVietnameseWelshWest IndianYakamaYaquiYugoslavianYumanYup'ikZimbabwean
Immigration
NonimmigrantsImmigrantsAfghanistanAfricaAlbaniaArgentinaArmeniaAsiaAustraliaAustriaBahamasBangladeshBarbadosBelarusBelgiumBelizeBoliviaBosnia and HerzegovinaBrazilBulgariaBurma/MyanmarCabo VerdeCambodiaCameroonCanadaCaribbeanCentral AmericaChileChinaColombiaCongoCosta RicaCroatiaCubaCzechoslovakiaDenmarkDominicaDominican RepublicEastern AfricaEastern AsiaEastern EuropeEcuadorEgyptEl SalvadorEnglandEritreaEthiopiaEuropeFijiFranceGermanyGhanaGreeceGrenadaGuatemalaGuyanaHaitiHondurasHong KongHungaryIndiaIndonesiaIranIraqIrelandIsraelItalyJamaicaJapanKazakhstanKenyaKoreaKuwaitLaosLatin AmericaLatviaLebanonLiberiaLithuaniaMalaysiaMexicoMicronesiaMiddle AfricaMoldovaMoroccoNepalNetherlandsNicaraguaNigeriaNorth AmericaNorth MacedoniaNorthern AfricaNorthern EuropeNorwayOceaniaPakistanPanamaPeruPhilippinesPolandPortugalRomaniaRussiaSaudi ArabiaScotlandSenegalSerbiaSierra LeoneSingaporeSomaliaSouth AfricaSouth AmericaSouth Central AsiaSouth Eastern AsiaSouthern EuropeSpainSri LankaSt. Vincent and the GrenadinesSudanSwedenSwitzerlandSyriaTaiwanThailandTrinidad and TobagoTurkeyUgandaUkraineUruguayUzbekistanVenezuelaVietnamWest IndiesWestern AfricaWestern AsiaWestern EuropeYemenZaireZimbabweAzores
Immigrants from Jordan
Race
Ancestry
AfghanAfricanAlaska NativeAlaskan AthabascanAlbanianAleutAlsatianAmericanApacheArabArapahoArgentineanArmenianAssyrian/Chaldean/SyriacAustralianAustrianBahamianBangladeshiBarbadianBasqueBelgianBelizeanBermudanBhutaneseBlackfeetBolivianBrazilianBritish West IndianBulgarianBurmeseCajunCambodianCanadianCape VerdeanCarpatho RusynCelticCentral AmericanCentral American IndianCherokeeCheyenneChickasawChileanChineseChippewaChoctawColombianColvilleComancheCosta RicanCreeCreekCroatianCrowCubanCypriotCzechCzechoslovakianDanishDelawareDominicanDutchDutch West IndianEastern EuropeanEcuadorianEgyptianEnglishEstonianEthiopianEuropeanFijianFilipinoFinnishFrenchFrench American IndianFrench CanadianGermanGerman RussianGhanaianGreekGuamanian/ChamorroGuatemalanGuyaneseHaitianHmongHonduranHopiHoumaHungarianIcelanderIndian (Asian)IndonesianInupiatIranianIraqiIrishIroquoisIsraeliItalianJamaicanJapaneseJordanianKenyanKiowaKoreanLaotianLatvianLebaneseLiberianLithuanianLumbeeLuxembourgerMacedonianMalaysianMalteseMarshalleseMenomineeMexicanMexican American IndianMongolianMoroccanNative HawaiianNavajoNepaleseNew ZealanderNicaraguanNigerianNorthern EuropeanNorwegianOkinawanOsageOttawaPaiutePakistaniPalestinianPanamanianParaguayanPennsylvania GermanPeruvianPimaPolishPortuguesePotawatomiPuebloPuerto RicanPuget Sound SalishRomanianRussianSalvadoranSamoanScandinavianScotch-IrishScottishSeminoleSenegaleseSerbianShoshoneSierra LeoneanSiouxSlavicSlovakSloveneSomaliSouth AfricanSouth AmericanSouth American IndianSoviet UnionSpaniardSpanishSpanish AmericanSpanish American IndianSri LankanSubsaharan AfricanSudaneseSwedishSwissSyrianTaiwaneseThaiTlingit-HaidaTohono O'OdhamTonganTrinidadian and TobagonianTsimshianTurkishU.S. Virgin IslanderUgandanUkrainianUruguayanUteVenezuelanVietnameseWelshWest IndianYakamaYaquiYugoslavianYumanYup'ikZimbabwean
Immigration
NonimmigrantsImmigrantsAfghanistanAfricaAlbaniaArgentinaArmeniaAsiaAustraliaAustriaBahamasBangladeshBarbadosBelarusBelgiumBelizeBoliviaBosnia and HerzegovinaBrazilBulgariaBurma/MyanmarCabo VerdeCambodiaCameroonCanadaCaribbeanCentral AmericaChileChinaColombiaCongoCosta RicaCroatiaCubaCzechoslovakiaDenmarkDominicaDominican RepublicEastern AfricaEastern AsiaEastern EuropeEcuadorEgyptEl SalvadorEnglandEritreaEthiopiaEuropeFijiFranceGermanyGhanaGreeceGrenadaGuatemalaGuyanaHaitiHondurasHong KongHungaryIndiaIndonesiaIranIraqIrelandIsraelItalyJamaicaJapanJordanKazakhstanKenyaKoreaKuwaitLaosLatin AmericaLatviaLebanonLiberiaLithuaniaMalaysiaMexicoMicronesiaMiddle AfricaMoldovaMoroccoNepalNetherlandsNicaraguaNigeriaNorth AmericaNorth MacedoniaNorthern AfricaNorthern EuropeNorwayOceaniaPakistanPanamaPeruPhilippinesPolandPortugalRomaniaRussiaSaudi ArabiaScotlandSenegalSerbiaSierra LeoneSingaporeSomaliaSouth AfricaSouth AmericaSouth Central AsiaSouth Eastern AsiaSouthern EuropeSpainSri LankaSt. Vincent and the GrenadinesSudanSwedenSwitzerlandSyriaTaiwanThailandTrinidad and TobagoTurkeyUgandaUkraineUruguayUzbekistanVenezuelaVietnamWest IndiesWestern AfricaWestern AsiaWestern EuropeYemenZaireZimbabweAzores
Unemployment Among Ages 20 to 24 years
Income
Poverty
Unemployment
Labor Participation
Family Structure
Vehicle Availability
Education Level
Disability

Unemployment Among Ages 20 to 24 years Comparison

British

Immigrants from Jordan

Exceptional
Good
9.8%
UNEMPLOYMENT AMONG AGES 20 TO 24 YEARS
99.4/ 100
METRIC RATING
63rd/ 347
METRIC RANK
10.2%
UNEMPLOYMENT AMONG AGES 20 TO 24 YEARS
79.0/ 100
METRIC RATING
143rd/ 347
METRIC RANK

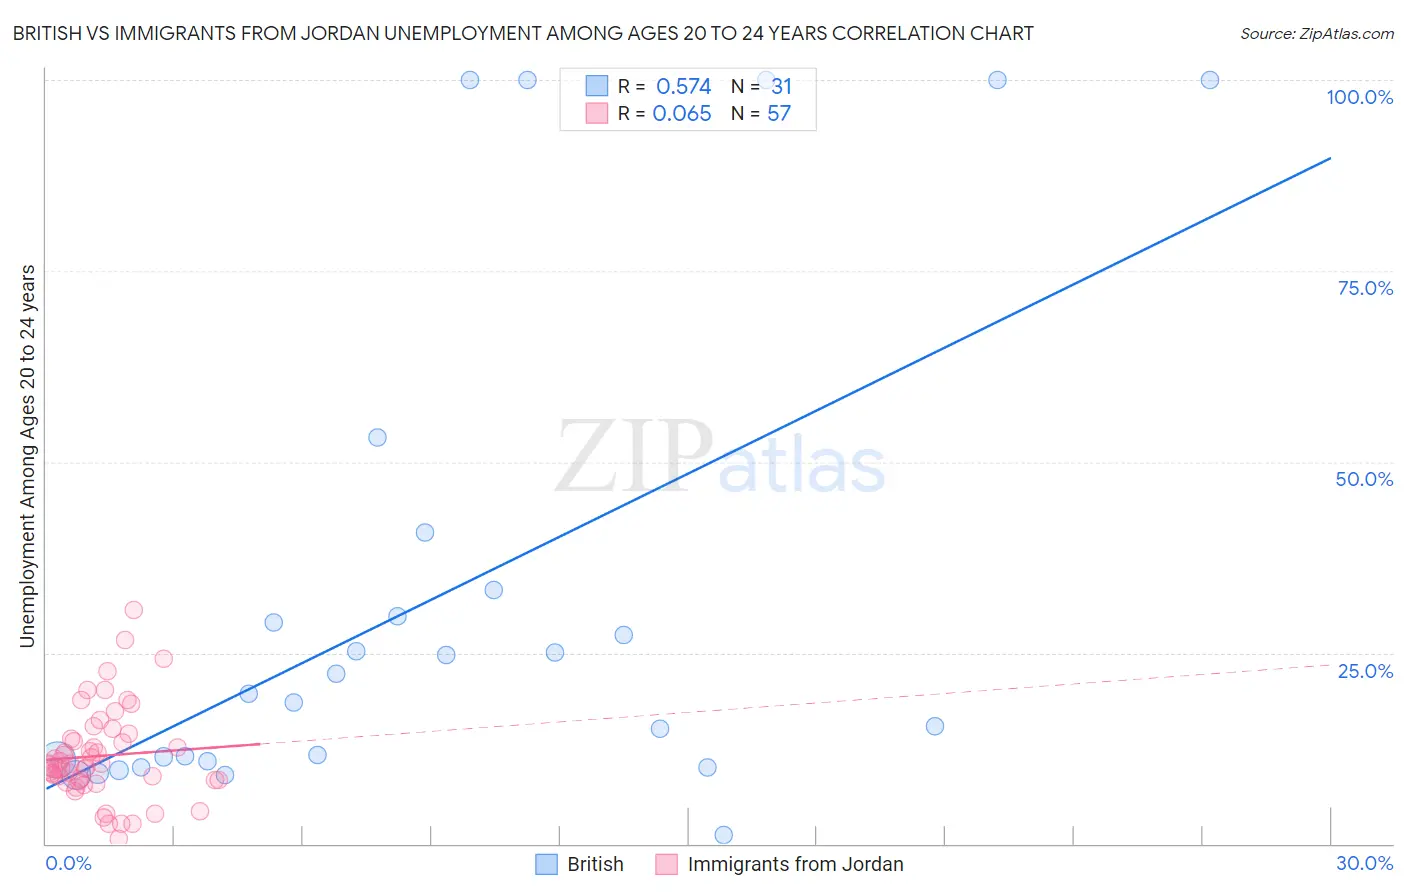
British vs Immigrants from Jordan Unemployment Among Ages 20 to 24 years Correlation Chart

The statistical analysis conducted on geographies consisting of 495,891,329 people shows a substantial positive correlation between the proportion of British and unemployment rate among population between the ages 20 and 24 in the United States with a correlation coefficient (R) of 0.574 and weighted average of 9.8%. Similarly, the statistical analysis conducted on geographies consisting of 179,606,549 people shows a slight positive correlation between the proportion of Immigrants from Jordan and unemployment rate among population between the ages 20 and 24 in the United States with a correlation coefficient (R) of 0.065 and weighted average of 10.2%, a difference of 3.6%.
British vs Immigrants from Jordan Unemployment Among Ages 20 to 24 years

Unemployment Among Ages 20 to 24 years Correlation Summary

MeasurementBritishImmigrants from Jordan
Minimum1.1%0.60%
Maximum100.0%30.6%
Range98.9%30.0%
Mean32.0%11.5%
Median19.6%10.2%
Interquartile 25% (IQ1)10.9%8.3%
Interquartile 75% (IQ3)33.3%14.1%
Interquartile Range (IQR)22.4%5.8%
Standard Deviation (Sample)32.1%6.0%
Standard Deviation (Population)31.6%6.0%

Similar Demographics by Unemployment Among Ages 20 to 24 years

Demographics Similar to British by Unemployment Among Ages 20 to 24 years

In terms of unemployment among ages 20 to 24 years, the demographic groups most similar to British are Serbian (9.8%, a difference of 0.0%), Immigrants from Singapore (9.8%, a difference of 0.010%), Welsh (9.8%, a difference of 0.070%), Malaysian (9.8%, a difference of 0.11%), and Immigrants from Kuwait (9.8%, a difference of 0.13%).
DemographicsRating | RankUnemployment Among Ages 20 to 24 years
Nicaraguans
99.6
/100
|
#56
Exceptional
9.8%
Immigrants | Moldova
99.5
/100
|
#57
Exceptional
9.8%
Pakistanis
99.5
/100
|
#58
Exceptional
9.8%
English
99.5
/100
|
#59
Exceptional
9.8%
Immigrants | Kuwait
99.5
/100
|
#60
Exceptional
9.8%
Malaysians
99.5
/100
|
#61
Exceptional
9.8%
Immigrants | Singapore
99.4
/100
|
#62
Exceptional
9.8%
British
99.4
/100
|
#63
Exceptional
9.8%
Serbians
99.4
/100
|
#64
Exceptional
9.8%
Welsh
99.3
/100
|
#65
Exceptional
9.8%
Scottish
99.3
/100
|
#66
Exceptional
9.8%
Immigrants | Bolivia
99.2
/100
|
#67
Exceptional
9.9%
Mongolians
99.1
/100
|
#68
Exceptional
9.9%
Bulgarians
99.1
/100
|
#69
Exceptional
9.9%
Immigrants | Croatia
99.0
/100
|
#70
Exceptional
9.9%

Demographics Similar to Immigrants from Jordan by Unemployment Among Ages 20 to 24 years

In terms of unemployment among ages 20 to 24 years, the demographic groups most similar to Immigrants from Jordan are Brazilian (10.2%, a difference of 0.040%), Argentinean (10.2%, a difference of 0.060%), Slovak (10.2%, a difference of 0.070%), Asian (10.2%, a difference of 0.070%), and French Canadian (10.2%, a difference of 0.080%).
DemographicsRating | RankUnemployment Among Ages 20 to 24 years
Immigrants | Northern Africa
82.5
/100
|
#136
Excellent
10.2%
Immigrants | North America
82.5
/100
|
#137
Excellent
10.2%
Burmese
82.3
/100
|
#138
Excellent
10.2%
Uruguayans
81.9
/100
|
#139
Excellent
10.2%
Immigrants | Austria
81.4
/100
|
#140
Excellent
10.2%
Immigrants | Azores
81.4
/100
|
#141
Excellent
10.2%
Slovaks
80.2
/100
|
#142
Excellent
10.2%
Immigrants | Jordan
79.0
/100
|
#143
Good
10.2%
Brazilians
78.4
/100
|
#144
Good
10.2%
Argentineans
78.0
/100
|
#145
Good
10.2%
Asians
77.7
/100
|
#146
Good
10.2%
French Canadians
77.5
/100
|
#147
Good
10.2%
Immigrants | Romania
75.7
/100
|
#148
Good
10.2%
Immigrants | Scotland
74.6
/100
|
#149
Good
10.2%
Hungarians
74.4
/100
|
#150
Good
10.2%