British vs Immigrants from Cuba Unemployment Among Youth under 25 years
COMPARE
British
Immigrants from Cuba
Unemployment Among Youth under 25 years
Unemployment Among Youth under 25 years Comparison
British
Immigrants from Cuba
10.9%
UNEMPLOYMENT AMONG YOUTH UNDER 25 YEARS
99.7/ 100
METRIC RATING
43rd/ 347
METRIC RANK
10.0%
UNEMPLOYMENT AMONG YOUTH UNDER 25 YEARS
100.0/ 100
METRIC RATING
2nd/ 347
METRIC RANK
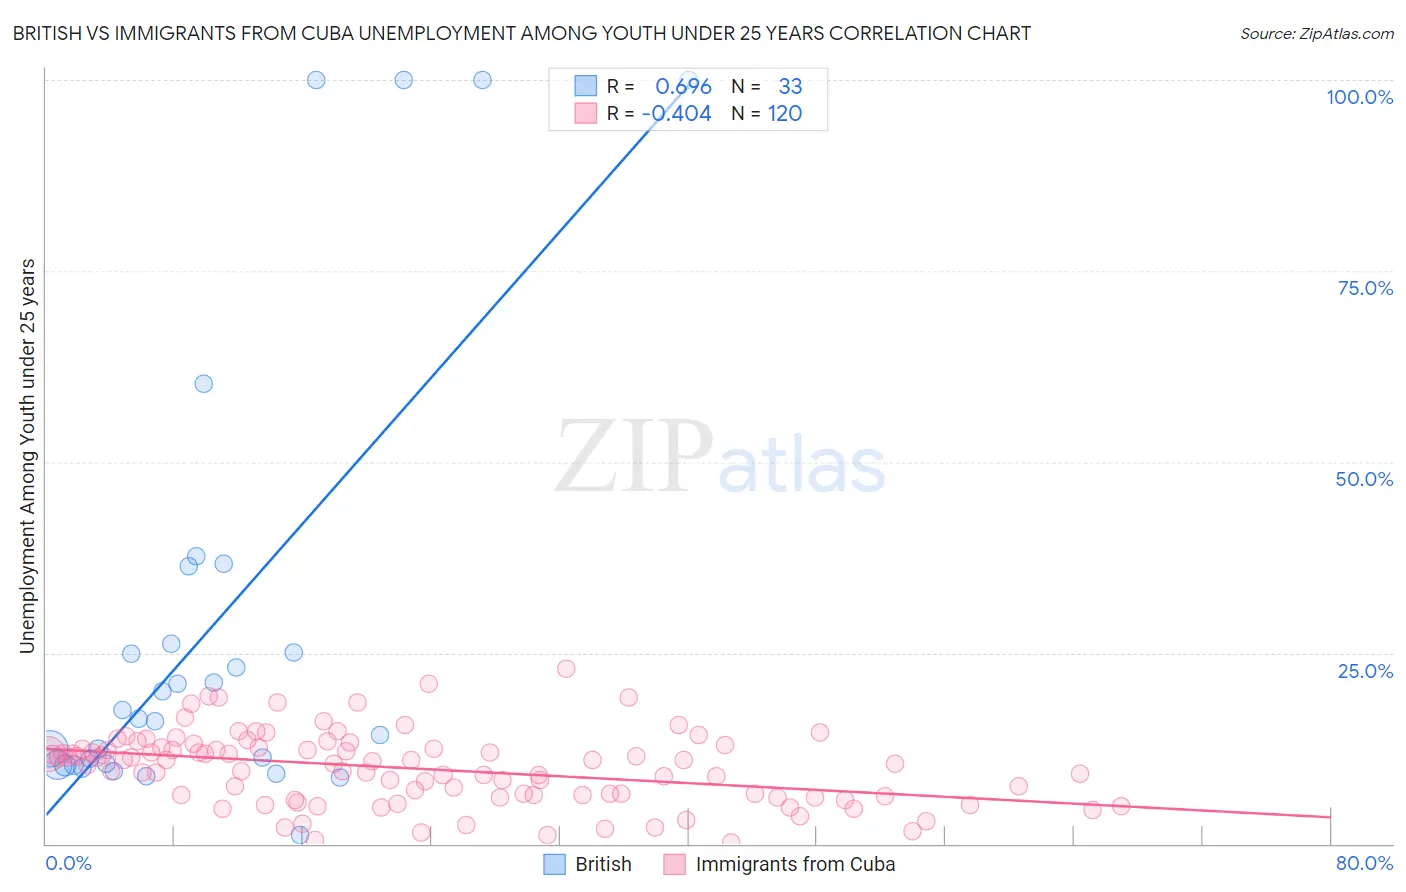
British vs Immigrants from Cuba Unemployment Among Youth under 25 years Correlation Chart
The statistical analysis conducted on geographies consisting of 515,109,769 people shows a significant positive correlation between the proportion of British and unemployment rate among youth under the age of 25 in the United States with a correlation coefficient (R) of 0.696 and weighted average of 10.9%. Similarly, the statistical analysis conducted on geographies consisting of 322,774,698 people shows a moderate negative correlation between the proportion of Immigrants from Cuba and unemployment rate among youth under the age of 25 in the United States with a correlation coefficient (R) of -0.404 and weighted average of 10.0%, a difference of 9.3%.
Unemployment Among Youth under 25 years Correlation Summary
| Measurement | British | Immigrants from Cuba |
| Minimum | 1.1% | 0.10% |
| Maximum | 100.0% | 22.9% |
| Range | 98.9% | 22.8% |
| Mean | 28.2% | 9.9% |
| Median | 16.4% | 10.6% |
| Interquartile 25% (IQ1) | 10.3% | 6.3% |
| Interquartile 75% (IQ3) | 31.2% | 12.6% |
| Interquartile Range (IQR) | 20.9% | 6.3% |
| Standard Deviation (Sample) | 29.4% | 4.7% |
| Standard Deviation (Population) | 28.9% | 4.7% |
Similar Demographics by Unemployment Among Youth under 25 years
Demographics Similar to British by Unemployment Among Youth under 25 years
In terms of unemployment among youth under 25 years, the demographic groups most similar to British are Welsh (10.9%, a difference of 0.020%), Bulgarian (10.9%, a difference of 0.13%), Tongan (10.9%, a difference of 0.17%), Australian (10.9%, a difference of 0.21%), and Cambodian (10.9%, a difference of 0.26%).
| Demographics | Rating | Rank | Unemployment Among Youth under 25 years |
| Hmong | 99.8 /100 | #36 | Exceptional 10.8% |
| Immigrants | Zimbabwe | 99.8 /100 | #37 | Exceptional 10.8% |
| Immigrants | Congo | 99.8 /100 | #38 | Exceptional 10.9% |
| Immigrants | Zaire | 99.8 /100 | #39 | Exceptional 10.9% |
| Scottish | 99.8 /100 | #40 | Exceptional 10.9% |
| Croatians | 99.8 /100 | #41 | Exceptional 10.9% |
| Cambodians | 99.7 /100 | #42 | Exceptional 10.9% |
| British | 99.7 /100 | #43 | Exceptional 10.9% |
| Welsh | 99.7 /100 | #44 | Exceptional 10.9% |
| Bulgarians | 99.6 /100 | #45 | Exceptional 10.9% |
| Tongans | 99.6 /100 | #46 | Exceptional 10.9% |
| Australians | 99.6 /100 | #47 | Exceptional 10.9% |
| Poles | 99.3 /100 | #48 | Exceptional 11.0% |
| Thais | 99.3 /100 | #49 | Exceptional 11.0% |
| Czechoslovakians | 99.2 /100 | #50 | Exceptional 11.0% |
Demographics Similar to Immigrants from Cuba by Unemployment Among Youth under 25 years
In terms of unemployment among youth under 25 years, the demographic groups most similar to Immigrants from Cuba are Luxembourger (10.0%, a difference of 0.28%), Norwegian (9.8%, a difference of 1.6%), Zimbabwean (10.2%, a difference of 1.9%), Czech (10.3%, a difference of 3.0%), and Danish (10.3%, a difference of 3.2%).
| Demographics | Rating | Rank | Unemployment Among Youth under 25 years |
| Norwegians | 100.0 /100 | #1 | Exceptional 9.8% |
| Immigrants | Cuba | 100.0 /100 | #2 | Exceptional 10.0% |
| Luxembourgers | 100.0 /100 | #3 | Exceptional 10.0% |
| Zimbabweans | 100.0 /100 | #4 | Exceptional 10.2% |
| Czechs | 100.0 /100 | #5 | Exceptional 10.3% |
| Danes | 100.0 /100 | #6 | Exceptional 10.3% |
| Swedes | 100.0 /100 | #7 | Exceptional 10.4% |
| Immigrants | Venezuela | 100.0 /100 | #8 | Exceptional 10.5% |
| Germans | 100.0 /100 | #9 | Exceptional 10.5% |
| Immigrants | Somalia | 100.0 /100 | #10 | Exceptional 10.5% |
| Scandinavians | 100.0 /100 | #11 | Exceptional 10.5% |
| Immigrants | Sudan | 100.0 /100 | #12 | Exceptional 10.5% |
| Indonesians | 100.0 /100 | #13 | Exceptional 10.6% |
| Cubans | 100.0 /100 | #14 | Exceptional 10.6% |
| Sudanese | 100.0 /100 | #15 | Exceptional 10.6% |