British vs Immigrants from Canada Unemployment Among Ages 16 to 19 years
COMPARE
British
Immigrants from Canada
Unemployment Among Ages 16 to 19 years
Unemployment Among Ages 16 to 19 years Comparison
British
Immigrants from Canada
16.5%
UNEMPLOYMENT AMONG AGES 16 TO 19 YEARS
99.5/ 100
METRIC RATING
54th/ 347
METRIC RANK
16.7%
UNEMPLOYMENT AMONG AGES 16 TO 19 YEARS
98.5/ 100
METRIC RATING
72nd/ 347
METRIC RANK
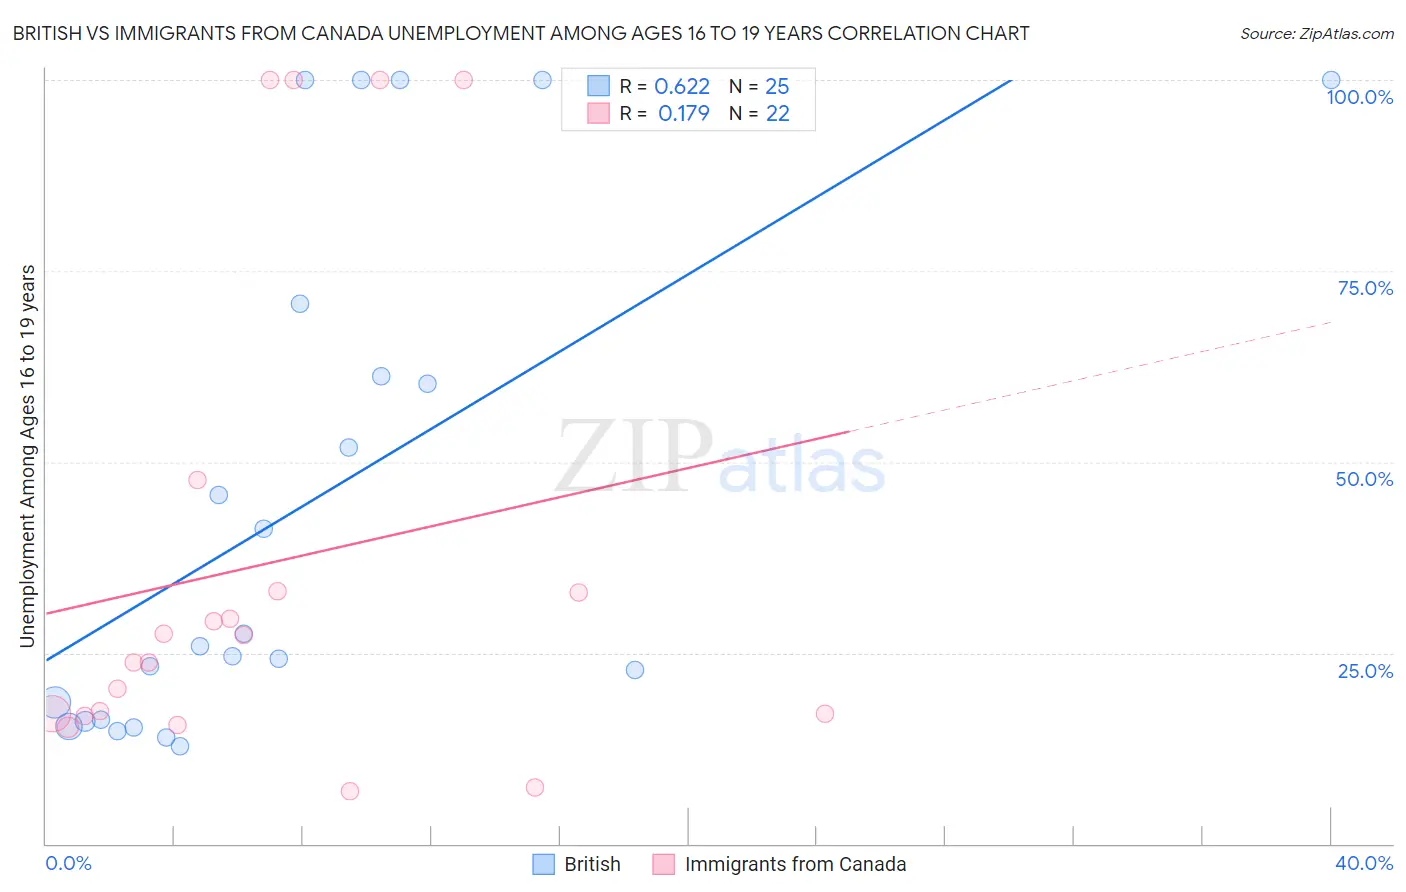
British vs Immigrants from Canada Unemployment Among Ages 16 to 19 years Correlation Chart
The statistical analysis conducted on geographies consisting of 483,657,198 people shows a significant positive correlation between the proportion of British and unemployment rate among population between the ages 16 and 19 in the United States with a correlation coefficient (R) of 0.622 and weighted average of 16.5%. Similarly, the statistical analysis conducted on geographies consisting of 428,472,270 people shows a poor positive correlation between the proportion of Immigrants from Canada and unemployment rate among population between the ages 16 and 19 in the United States with a correlation coefficient (R) of 0.179 and weighted average of 16.7%, a difference of 1.5%.
Unemployment Among Ages 16 to 19 years Correlation Summary
| Measurement | British | Immigrants from Canada |
| Minimum | 12.7% | 6.9% |
| Maximum | 100.0% | 100.0% |
| Range | 87.3% | 93.1% |
| Mean | 44.1% | 36.7% |
| Median | 25.8% | 25.5% |
| Interquartile 25% (IQ1) | 16.1% | 17.0% |
| Interquartile 75% (IQ3) | 66.0% | 33.0% |
| Interquartile Range (IQR) | 49.9% | 16.0% |
| Standard Deviation (Sample) | 32.8% | 31.8% |
| Standard Deviation (Population) | 32.2% | 31.1% |
Demographics Similar to British and Immigrants from Canada by Unemployment Among Ages 16 to 19 years
In terms of unemployment among ages 16 to 19 years, the demographic groups most similar to British are Czechoslovakian (16.5%, a difference of 0.020%), Slovene (16.4%, a difference of 0.050%), Sri Lankan (16.5%, a difference of 0.050%), Immigrants from Jordan (16.5%, a difference of 0.32%), and Immigrants from Uganda (16.5%, a difference of 0.37%). Similarly, the demographic groups most similar to Immigrants from Canada are Latvian (16.7%, a difference of 0.040%), Austrian (16.7%, a difference of 0.10%), Serbian (16.7%, a difference of 0.16%), Slavic (16.7%, a difference of 0.24%), and Chickasaw (16.7%, a difference of 0.24%).
| Demographics | Rating | Rank | Unemployment Among Ages 16 to 19 years |
| Slovenes | 99.6 /100 | #53 | Exceptional 16.4% |
| British | 99.5 /100 | #54 | Exceptional 16.5% |
| Czechoslovakians | 99.5 /100 | #55 | Exceptional 16.5% |
| Sri Lankans | 99.5 /100 | #56 | Exceptional 16.5% |
| Immigrants | Jordan | 99.4 /100 | #57 | Exceptional 16.5% |
| Immigrants | Uganda | 99.4 /100 | #58 | Exceptional 16.5% |
| Irish | 99.4 /100 | #59 | Exceptional 16.5% |
| Menominee | 99.3 /100 | #60 | Exceptional 16.6% |
| Immigrants | Cuba | 99.2 /100 | #61 | Exceptional 16.6% |
| Macedonians | 99.2 /100 | #62 | Exceptional 16.6% |
| Scotch-Irish | 99.1 /100 | #63 | Exceptional 16.6% |
| Northern Europeans | 99.0 /100 | #64 | Exceptional 16.6% |
| Immigrants | Japan | 98.9 /100 | #65 | Exceptional 16.6% |
| Okinawans | 98.9 /100 | #66 | Exceptional 16.6% |
| Slavs | 98.7 /100 | #67 | Exceptional 16.7% |
| Chickasaw | 98.7 /100 | #68 | Exceptional 16.7% |
| Serbians | 98.7 /100 | #69 | Exceptional 16.7% |
| Austrians | 98.6 /100 | #70 | Exceptional 16.7% |
| Latvians | 98.5 /100 | #71 | Exceptional 16.7% |
| Immigrants | Canada | 98.5 /100 | #72 | Exceptional 16.7% |
| Lithuanians | 98.2 /100 | #73 | Exceptional 16.7% |