Brazilian vs Alsatian Unemployment Among Youth under 25 years
COMPARE
Brazilian
Alsatian
Unemployment Among Youth under 25 years
Unemployment Among Youth under 25 years Comparison
Brazilians
Alsatians
11.5%
UNEMPLOYMENT AMONG YOUTH UNDER 25 YEARS
72.5/ 100
METRIC RATING
146th/ 347
METRIC RANK
11.9%
UNEMPLOYMENT AMONG YOUTH UNDER 25 YEARS
6.1/ 100
METRIC RATING
220th/ 347
METRIC RANK
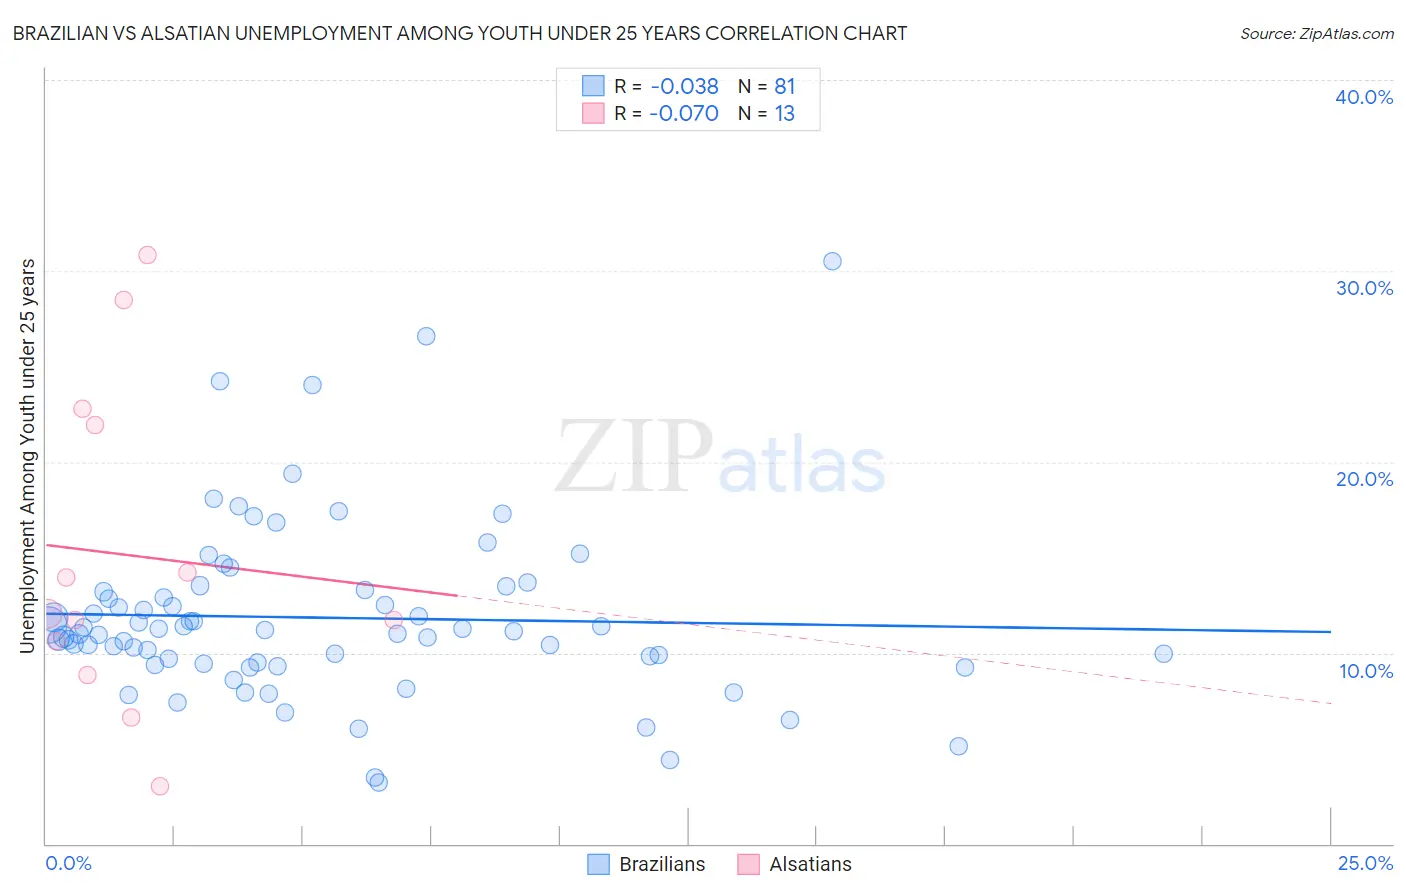
Brazilian vs Alsatian Unemployment Among Youth under 25 years Correlation Chart
The statistical analysis conducted on geographies consisting of 321,254,906 people shows no correlation between the proportion of Brazilians and unemployment rate among youth under the age of 25 in the United States with a correlation coefficient (R) of -0.038 and weighted average of 11.5%. Similarly, the statistical analysis conducted on geographies consisting of 82,312,882 people shows a slight negative correlation between the proportion of Alsatians and unemployment rate among youth under the age of 25 in the United States with a correlation coefficient (R) of -0.070 and weighted average of 11.9%, a difference of 3.8%.
Unemployment Among Youth under 25 years Correlation Summary
| Measurement | Brazilian | Alsatian |
| Minimum | 3.2% | 3.0% |
| Maximum | 30.5% | 30.8% |
| Range | 27.3% | 27.8% |
| Mean | 11.8% | 15.1% |
| Median | 11.1% | 12.0% |
| Interquartile 25% (IQ1) | 9.5% | 9.7% |
| Interquartile 75% (IQ3) | 13.3% | 22.4% |
| Interquartile Range (IQR) | 3.8% | 12.6% |
| Standard Deviation (Sample) | 4.7% | 8.4% |
| Standard Deviation (Population) | 4.6% | 8.1% |
Similar Demographics by Unemployment Among Youth under 25 years
Demographics Similar to Brazilians by Unemployment Among Youth under 25 years
In terms of unemployment among youth under 25 years, the demographic groups most similar to Brazilians are Laotian (11.5%, a difference of 0.0%), Argentinean (11.5%, a difference of 0.020%), Immigrants from Northern Europe (11.5%, a difference of 0.020%), Immigrants from Cambodia (11.5%, a difference of 0.040%), and Immigrants from Switzerland (11.5%, a difference of 0.050%).
| Demographics | Rating | Rank | Unemployment Among Youth under 25 years |
| Immigrants | Indonesia | 77.6 /100 | #139 | Good 11.5% |
| Immigrants | Belgium | 77.5 /100 | #140 | Good 11.5% |
| Immigrants | Uruguay | 76.1 /100 | #141 | Good 11.5% |
| Immigrants | Korea | 75.1 /100 | #142 | Good 11.5% |
| Immigrants | Uganda | 74.5 /100 | #143 | Good 11.5% |
| Immigrants | Brazil | 74.3 /100 | #144 | Good 11.5% |
| Argentineans | 73.0 /100 | #145 | Good 11.5% |
| Brazilians | 72.5 /100 | #146 | Good 11.5% |
| Laotians | 72.4 /100 | #147 | Good 11.5% |
| Immigrants | Northern Europe | 72.1 /100 | #148 | Good 11.5% |
| Immigrants | Cambodia | 71.8 /100 | #149 | Good 11.5% |
| Immigrants | Switzerland | 71.6 /100 | #150 | Good 11.5% |
| Uruguayans | 70.4 /100 | #151 | Good 11.5% |
| Iraqis | 68.3 /100 | #152 | Good 11.5% |
| Immigrants | Czechoslovakia | 67.1 /100 | #153 | Good 11.5% |
Demographics Similar to Alsatians by Unemployment Among Youth under 25 years
In terms of unemployment among youth under 25 years, the demographic groups most similar to Alsatians are Nonimmigrants (11.9%, a difference of 0.020%), Immigrants from Middle Africa (11.9%, a difference of 0.13%), Yaqui (11.9%, a difference of 0.14%), Guamanian/Chamorro (11.9%, a difference of 0.15%), and Samoan (11.9%, a difference of 0.21%).
| Demographics | Rating | Rank | Unemployment Among Youth under 25 years |
| South Americans | 8.5 /100 | #213 | Tragic 11.9% |
| Costa Ricans | 8.2 /100 | #214 | Tragic 11.9% |
| Samoans | 7.4 /100 | #215 | Tragic 11.9% |
| Guamanians/Chamorros | 7.0 /100 | #216 | Tragic 11.9% |
| Yaqui | 6.9 /100 | #217 | Tragic 11.9% |
| Immigrants | Middle Africa | 6.8 /100 | #218 | Tragic 11.9% |
| Immigrants | Nonimmigrants | 6.2 /100 | #219 | Tragic 11.9% |
| Alsatians | 6.1 /100 | #220 | Tragic 11.9% |
| Immigrants | Portugal | 4.9 /100 | #221 | Tragic 12.0% |
| Israelis | 4.1 /100 | #222 | Tragic 12.0% |
| Immigrants | Ireland | 3.5 /100 | #223 | Tragic 12.0% |
| Hawaiians | 3.5 /100 | #224 | Tragic 12.0% |
| Immigrants | Ukraine | 3.0 /100 | #225 | Tragic 12.0% |
| Immigrants | Israel | 2.6 /100 | #226 | Tragic 12.0% |
| Immigrants | Iran | 2.6 /100 | #227 | Tragic 12.0% |