Black/African American vs Vietnamese Unemployment Among Ages 65 to 74 years
COMPARE
Black/African American
Vietnamese
Unemployment Among Ages 65 to 74 years
Unemployment Among Ages 65 to 74 years Comparison
Blacks/African Americans
Vietnamese
5.8%
UNEMPLOYMENT AMONG AGES 65 TO 74 YEARS
0.0/ 100
METRIC RATING
295th/ 347
METRIC RANK
5.9%
UNEMPLOYMENT AMONG AGES 65 TO 74 YEARS
0.0/ 100
METRIC RATING
313th/ 347
METRIC RANK
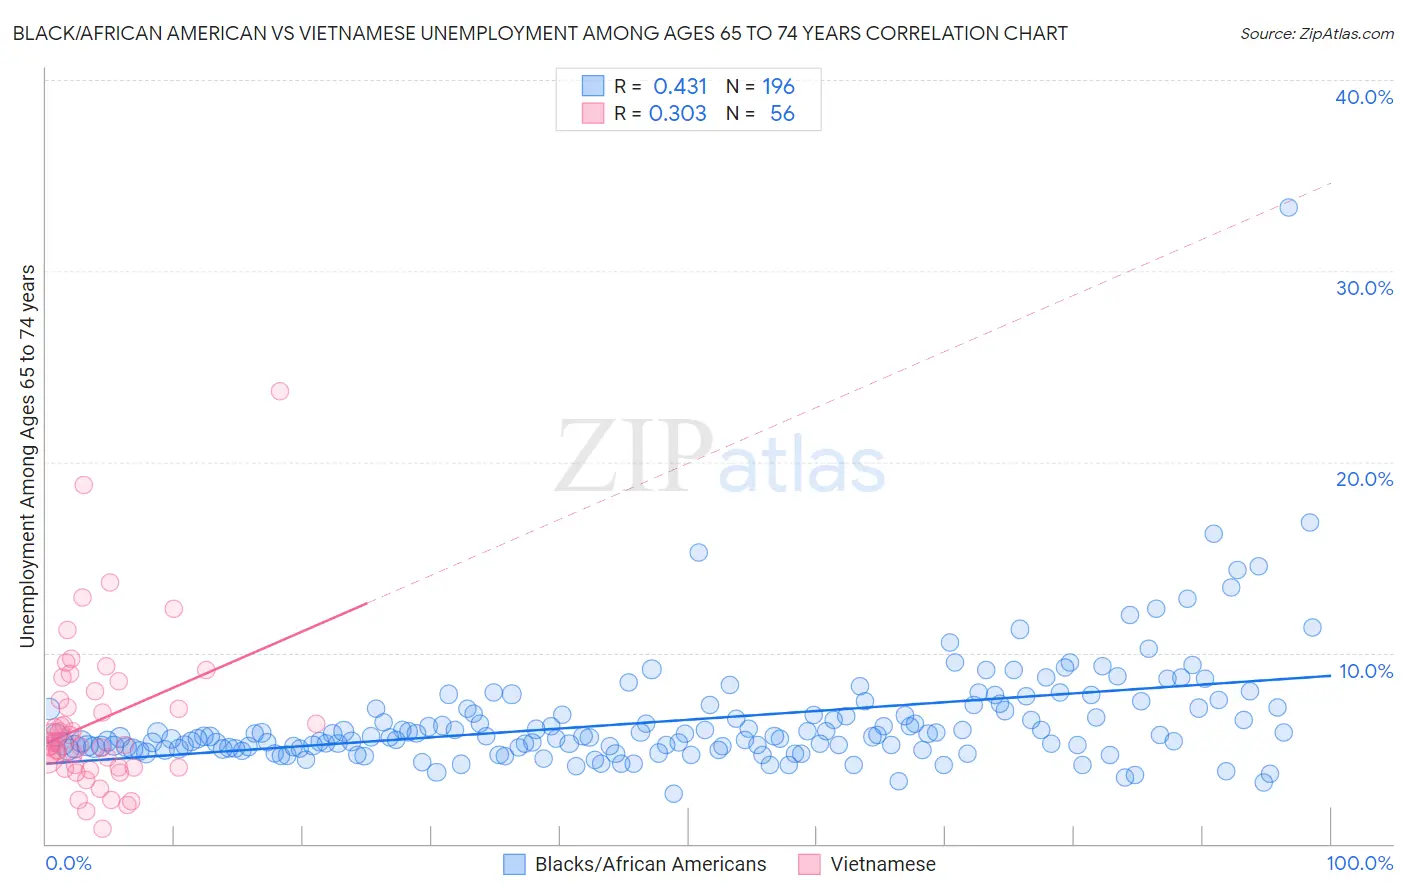
Black/African American vs Vietnamese Unemployment Among Ages 65 to 74 years Correlation Chart
The statistical analysis conducted on geographies consisting of 445,511,651 people shows a moderate positive correlation between the proportion of Blacks/African Americans and unemployment rate among population between the ages 65 and 74 in the United States with a correlation coefficient (R) of 0.431 and weighted average of 5.8%. Similarly, the statistical analysis conducted on geographies consisting of 162,170,002 people shows a mild positive correlation between the proportion of Vietnamese and unemployment rate among population between the ages 65 and 74 in the United States with a correlation coefficient (R) of 0.303 and weighted average of 5.9%, a difference of 1.6%.
Unemployment Among Ages 65 to 74 years Correlation Summary
| Measurement | Black/African American | Vietnamese |
| Minimum | 2.6% | 0.80% |
| Maximum | 33.3% | 23.7% |
| Range | 30.7% | 22.9% |
| Mean | 6.5% | 6.4% |
| Median | 5.6% | 5.3% |
| Interquartile 25% (IQ1) | 5.0% | 4.0% |
| Interquartile 75% (IQ3) | 7.1% | 7.8% |
| Interquartile Range (IQR) | 2.1% | 3.8% |
| Standard Deviation (Sample) | 3.0% | 4.0% |
| Standard Deviation (Population) | 3.0% | 4.0% |
Demographics Similar to Blacks/African Americans and Vietnamese by Unemployment Among Ages 65 to 74 years
In terms of unemployment among ages 65 to 74 years, the demographic groups most similar to Blacks/African Americans are Immigrants from Morocco (5.8%, a difference of 0.030%), Pennsylvania German (5.8%, a difference of 0.46%), Houma (5.8%, a difference of 0.63%), Immigrants from Latin America (5.8%, a difference of 0.82%), and Barbadian (5.8%, a difference of 0.83%). Similarly, the demographic groups most similar to Vietnamese are Immigrants from Venezuela (5.9%, a difference of 0.17%), Hispanic or Latino (5.9%, a difference of 0.19%), Venezuelan (5.9%, a difference of 0.21%), Immigrants from Bangladesh (5.9%, a difference of 0.25%), and Immigrants from Ecuador (5.8%, a difference of 0.39%).
| Demographics | Rating | Rank | Unemployment Among Ages 65 to 74 years |
| Immigrants | Morocco | 0.0 /100 | #294 | Tragic 5.8% |
| Blacks/African Americans | 0.0 /100 | #295 | Tragic 5.8% |
| Pennsylvania Germans | 0.0 /100 | #296 | Tragic 5.8% |
| Houma | 0.0 /100 | #297 | Tragic 5.8% |
| Immigrants | Latin America | 0.0 /100 | #298 | Tragic 5.8% |
| Barbadians | 0.0 /100 | #299 | Tragic 5.8% |
| Ecuadorians | 0.0 /100 | #300 | Tragic 5.8% |
| Armenians | 0.0 /100 | #301 | Tragic 5.8% |
| Liberians | 0.0 /100 | #302 | Tragic 5.8% |
| Arapaho | 0.0 /100 | #303 | Tragic 5.8% |
| Salvadorans | 0.0 /100 | #304 | Tragic 5.8% |
| Mexicans | 0.0 /100 | #305 | Tragic 5.8% |
| Cheyenne | 0.0 /100 | #306 | Tragic 5.8% |
| British West Indians | 0.0 /100 | #307 | Tragic 5.8% |
| Guatemalans | 0.0 /100 | #308 | Tragic 5.8% |
| Immigrants | Ecuador | 0.0 /100 | #309 | Tragic 5.8% |
| Immigrants | Bangladesh | 0.0 /100 | #310 | Tragic 5.9% |
| Venezuelans | 0.0 /100 | #311 | Tragic 5.9% |
| Hispanics or Latinos | 0.0 /100 | #312 | Tragic 5.9% |
| Vietnamese | 0.0 /100 | #313 | Tragic 5.9% |
| Immigrants | Venezuela | 0.0 /100 | #314 | Tragic 5.9% |