Blackfeet vs Pennsylvania German Unemployment Among Ages 16 to 19 years
COMPARE
Blackfeet
Pennsylvania German
Unemployment Among Ages 16 to 19 years
Unemployment Among Ages 16 to 19 years Comparison
Blackfeet
Pennsylvania Germans
19.2%
UNEMPLOYMENT AMONG AGES 16 TO 19 YEARS
0.0/ 100
METRIC RATING
271st/ 347
METRIC RANK
16.2%
UNEMPLOYMENT AMONG AGES 16 TO 19 YEARS
99.9/ 100
METRIC RATING
34th/ 347
METRIC RANK
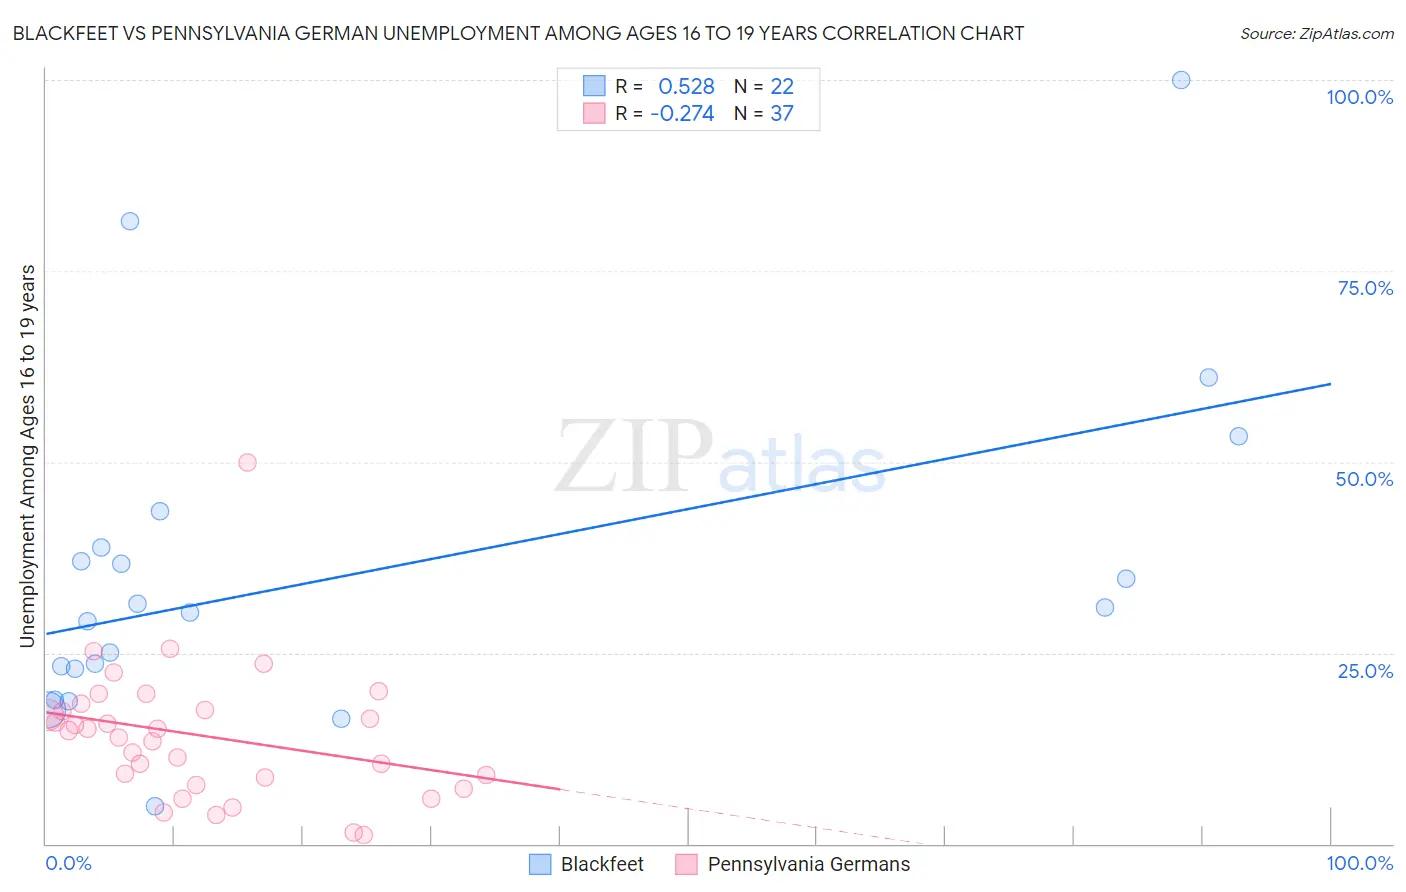
Blackfeet vs Pennsylvania German Unemployment Among Ages 16 to 19 years Correlation Chart
The statistical analysis conducted on geographies consisting of 297,030,644 people shows a substantial positive correlation between the proportion of Blackfeet and unemployment rate among population between the ages 16 and 19 in the United States with a correlation coefficient (R) of 0.528 and weighted average of 19.2%. Similarly, the statistical analysis conducted on geographies consisting of 221,699,953 people shows a weak negative correlation between the proportion of Pennsylvania Germans and unemployment rate among population between the ages 16 and 19 in the United States with a correlation coefficient (R) of -0.274 and weighted average of 16.2%, a difference of 18.6%.
Unemployment Among Ages 16 to 19 years Correlation Summary
| Measurement | Blackfeet | Pennsylvania German |
| Minimum | 4.9% | 1.2% |
| Maximum | 100.0% | 50.0% |
| Range | 95.1% | 48.8% |
| Mean | 35.4% | 14.2% |
| Median | 30.6% | 14.8% |
| Interquartile 25% (IQ1) | 22.9% | 8.1% |
| Interquartile 75% (IQ3) | 38.7% | 17.9% |
| Interquartile Range (IQR) | 15.9% | 9.8% |
| Standard Deviation (Sample) | 22.0% | 8.9% |
| Standard Deviation (Population) | 21.5% | 8.7% |
Similar Demographics by Unemployment Among Ages 16 to 19 years
Demographics Similar to Blackfeet by Unemployment Among Ages 16 to 19 years
In terms of unemployment among ages 16 to 19 years, the demographic groups most similar to Blackfeet are Hispanic or Latino (19.2%, a difference of 0.12%), Immigrants from Panama (19.3%, a difference of 0.25%), Honduran (19.2%, a difference of 0.38%), Shoshone (19.3%, a difference of 0.40%), and Lumbee (19.1%, a difference of 0.55%).
| Demographics | Rating | Rank | Unemployment Among Ages 16 to 19 years |
| Yaqui | 0.1 /100 | #264 | Tragic 19.0% |
| Choctaw | 0.1 /100 | #265 | Tragic 19.0% |
| Immigrants | Honduras | 0.1 /100 | #266 | Tragic 19.0% |
| Israelis | 0.1 /100 | #267 | Tragic 19.0% |
| Immigrants | El Salvador | 0.1 /100 | #268 | Tragic 19.1% |
| Lumbee | 0.1 /100 | #269 | Tragic 19.1% |
| Hondurans | 0.1 /100 | #270 | Tragic 19.2% |
| Blackfeet | 0.0 /100 | #271 | Tragic 19.2% |
| Hispanics or Latinos | 0.0 /100 | #272 | Tragic 19.2% |
| Immigrants | Panama | 0.0 /100 | #273 | Tragic 19.3% |
| Shoshone | 0.0 /100 | #274 | Tragic 19.3% |
| Paraguayans | 0.0 /100 | #275 | Tragic 19.4% |
| Immigrants | Latin America | 0.0 /100 | #276 | Tragic 19.4% |
| Immigrants | Western Africa | 0.0 /100 | #277 | Tragic 19.4% |
| Africans | 0.0 /100 | #278 | Tragic 19.5% |
Demographics Similar to Pennsylvania Germans by Unemployment Among Ages 16 to 19 years
In terms of unemployment among ages 16 to 19 years, the demographic groups most similar to Pennsylvania Germans are Immigrants from Kenya (16.2%, a difference of 0.030%), Scottish (16.2%, a difference of 0.15%), Immigrants from South Central Asia (16.2%, a difference of 0.16%), Immigrants from Congo (16.3%, a difference of 0.27%), and Bulgarian (16.3%, a difference of 0.28%).
| Demographics | Rating | Rank | Unemployment Among Ages 16 to 19 years |
| Immigrants | Sudan | 99.9 /100 | #27 | Exceptional 16.0% |
| Jordanians | 99.9 /100 | #28 | Exceptional 16.0% |
| Chinese | 99.9 /100 | #29 | Exceptional 16.0% |
| Kenyans | 99.9 /100 | #30 | Exceptional 16.1% |
| English | 99.9 /100 | #31 | Exceptional 16.1% |
| Europeans | 99.9 /100 | #32 | Exceptional 16.1% |
| Immigrants | Kenya | 99.9 /100 | #33 | Exceptional 16.2% |
| Pennsylvania Germans | 99.9 /100 | #34 | Exceptional 16.2% |
| Scottish | 99.8 /100 | #35 | Exceptional 16.2% |
| Immigrants | South Central Asia | 99.8 /100 | #36 | Exceptional 16.2% |
| Immigrants | Congo | 99.8 /100 | #37 | Exceptional 16.3% |
| Bulgarians | 99.8 /100 | #38 | Exceptional 16.3% |
| Croatians | 99.8 /100 | #39 | Exceptional 16.3% |
| Hmong | 99.8 /100 | #40 | Exceptional 16.3% |
| Immigrants | Nepal | 99.8 /100 | #41 | Exceptional 16.3% |