Blackfeet vs Cypriot Unemployment Among Women with Children Under 6 years
COMPARE
Blackfeet
Cypriot
Unemployment Among Women with Children Under 6 years
Unemployment Among Women with Children Under 6 years Comparison
Blackfeet
Cypriots
8.7%
UNEMPLOYMENT AMONG WOMEN WITH CHILDREN UNDER 6 YEARS
0.0/ 100
METRIC RATING
284th/ 347
METRIC RANK
6.5%
UNEMPLOYMENT AMONG WOMEN WITH CHILDREN UNDER 6 YEARS
100.0/ 100
METRIC RATING
26th/ 347
METRIC RANK
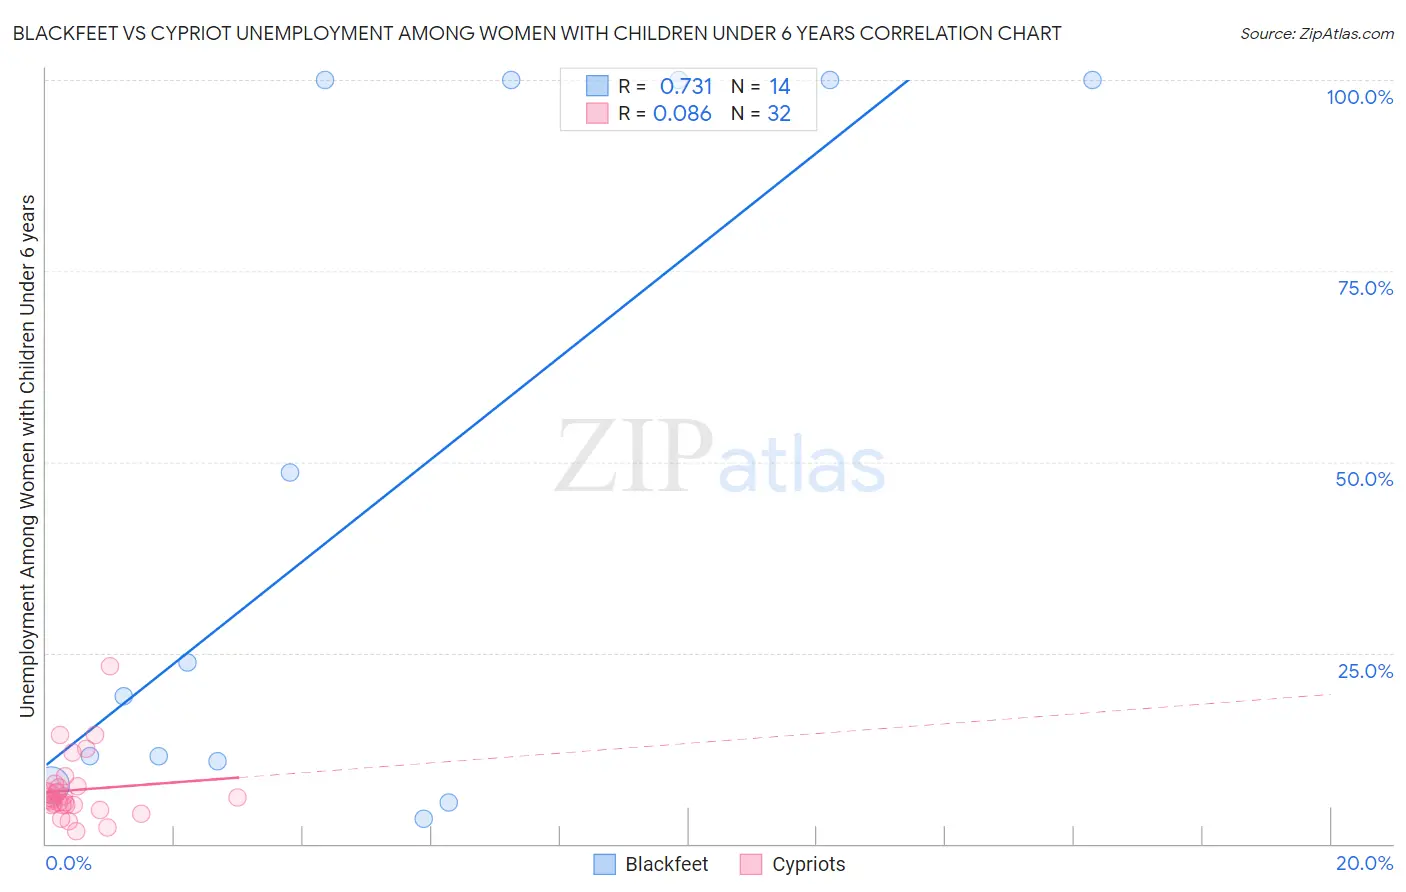
Blackfeet vs Cypriot Unemployment Among Women with Children Under 6 years Correlation Chart
The statistical analysis conducted on geographies consisting of 246,110,374 people shows a strong positive correlation between the proportion of Blackfeet and unemployment rate among women with children under the age of 6 in the United States with a correlation coefficient (R) of 0.731 and weighted average of 8.7%. Similarly, the statistical analysis conducted on geographies consisting of 55,986,412 people shows a slight positive correlation between the proportion of Cypriots and unemployment rate among women with children under the age of 6 in the United States with a correlation coefficient (R) of 0.086 and weighted average of 6.5%, a difference of 32.8%.
Unemployment Among Women with Children Under 6 years Correlation Summary
| Measurement | Blackfeet | Cypriot |
| Minimum | 3.2% | 1.6% |
| Maximum | 100.0% | 23.3% |
| Range | 96.8% | 21.7% |
| Mean | 45.8% | 7.0% |
| Median | 21.5% | 5.9% |
| Interquartile 25% (IQ1) | 10.7% | 5.1% |
| Interquartile 75% (IQ3) | 100.0% | 7.4% |
| Interquartile Range (IQR) | 89.3% | 2.4% |
| Standard Deviation (Sample) | 43.3% | 4.3% |
| Standard Deviation (Population) | 41.7% | 4.2% |
Similar Demographics by Unemployment Among Women with Children Under 6 years
Demographics Similar to Blackfeet by Unemployment Among Women with Children Under 6 years
In terms of unemployment among women with children under 6 years, the demographic groups most similar to Blackfeet are Spanish American Indian (8.7%, a difference of 0.16%), Bermudan (8.7%, a difference of 0.18%), U.S. Virgin Islander (8.7%, a difference of 0.20%), Seminole (8.7%, a difference of 0.20%), and Guatemalan (8.7%, a difference of 0.27%).
| Demographics | Rating | Rank | Unemployment Among Women with Children Under 6 years |
| Haitians | 0.0 /100 | #277 | Tragic 8.6% |
| Immigrants | Dominica | 0.0 /100 | #278 | Tragic 8.6% |
| Immigrants | Guatemala | 0.0 /100 | #279 | Tragic 8.6% |
| Immigrants | Belize | 0.0 /100 | #280 | Tragic 8.6% |
| Guatemalans | 0.0 /100 | #281 | Tragic 8.7% |
| Bermudans | 0.0 /100 | #282 | Tragic 8.7% |
| Spanish American Indians | 0.0 /100 | #283 | Tragic 8.7% |
| Blackfeet | 0.0 /100 | #284 | Tragic 8.7% |
| U.S. Virgin Islanders | 0.0 /100 | #285 | Tragic 8.7% |
| Seminole | 0.0 /100 | #286 | Tragic 8.7% |
| Menominee | 0.0 /100 | #287 | Tragic 8.7% |
| Bahamians | 0.0 /100 | #288 | Tragic 8.7% |
| Iroquois | 0.0 /100 | #289 | Tragic 8.7% |
| Vietnamese | 0.0 /100 | #290 | Tragic 8.8% |
| Jamaicans | 0.0 /100 | #291 | Tragic 8.8% |
Demographics Similar to Cypriots by Unemployment Among Women with Children Under 6 years
In terms of unemployment among women with children under 6 years, the demographic groups most similar to Cypriots are Soviet Union (6.5%, a difference of 0.080%), Laotian (6.5%, a difference of 0.10%), Immigrants from Japan (6.5%, a difference of 0.10%), Immigrants from Israel (6.5%, a difference of 0.12%), and Bulgarian (6.5%, a difference of 0.25%).
| Demographics | Rating | Rank | Unemployment Among Women with Children Under 6 years |
| Mongolians | 100.0 /100 | #19 | Exceptional 6.5% |
| Ute | 100.0 /100 | #20 | Exceptional 6.5% |
| Burmese | 100.0 /100 | #21 | Exceptional 6.5% |
| Immigrants | Korea | 100.0 /100 | #22 | Exceptional 6.5% |
| Bulgarians | 100.0 /100 | #23 | Exceptional 6.5% |
| Laotians | 100.0 /100 | #24 | Exceptional 6.5% |
| Soviet Union | 100.0 /100 | #25 | Exceptional 6.5% |
| Cypriots | 100.0 /100 | #26 | Exceptional 6.5% |
| Immigrants | Japan | 100.0 /100 | #27 | Exceptional 6.5% |
| Immigrants | Israel | 100.0 /100 | #28 | Exceptional 6.5% |
| Immigrants | Sweden | 100.0 /100 | #29 | Exceptional 6.6% |
| Immigrants | Belarus | 100.0 /100 | #30 | Exceptional 6.6% |
| Immigrants | Moldova | 100.0 /100 | #31 | Exceptional 6.6% |
| Tsimshian | 100.0 /100 | #32 | Exceptional 6.6% |
| Immigrants | Vietnam | 100.0 /100 | #33 | Exceptional 6.6% |