Bermudan vs Immigrants from Southern Europe Unemployment Among Ages 16 to 19 years
COMPARE
Bermudan
Immigrants from Southern Europe
Unemployment Among Ages 16 to 19 years
Unemployment Among Ages 16 to 19 years Comparison
Bermudans
Immigrants from Southern Europe
17.6%
UNEMPLOYMENT AMONG AGES 16 TO 19 YEARS
48.7/ 100
METRIC RATING
177th/ 347
METRIC RANK
17.9%
UNEMPLOYMENT AMONG AGES 16 TO 19 YEARS
18.9/ 100
METRIC RATING
206th/ 347
METRIC RANK
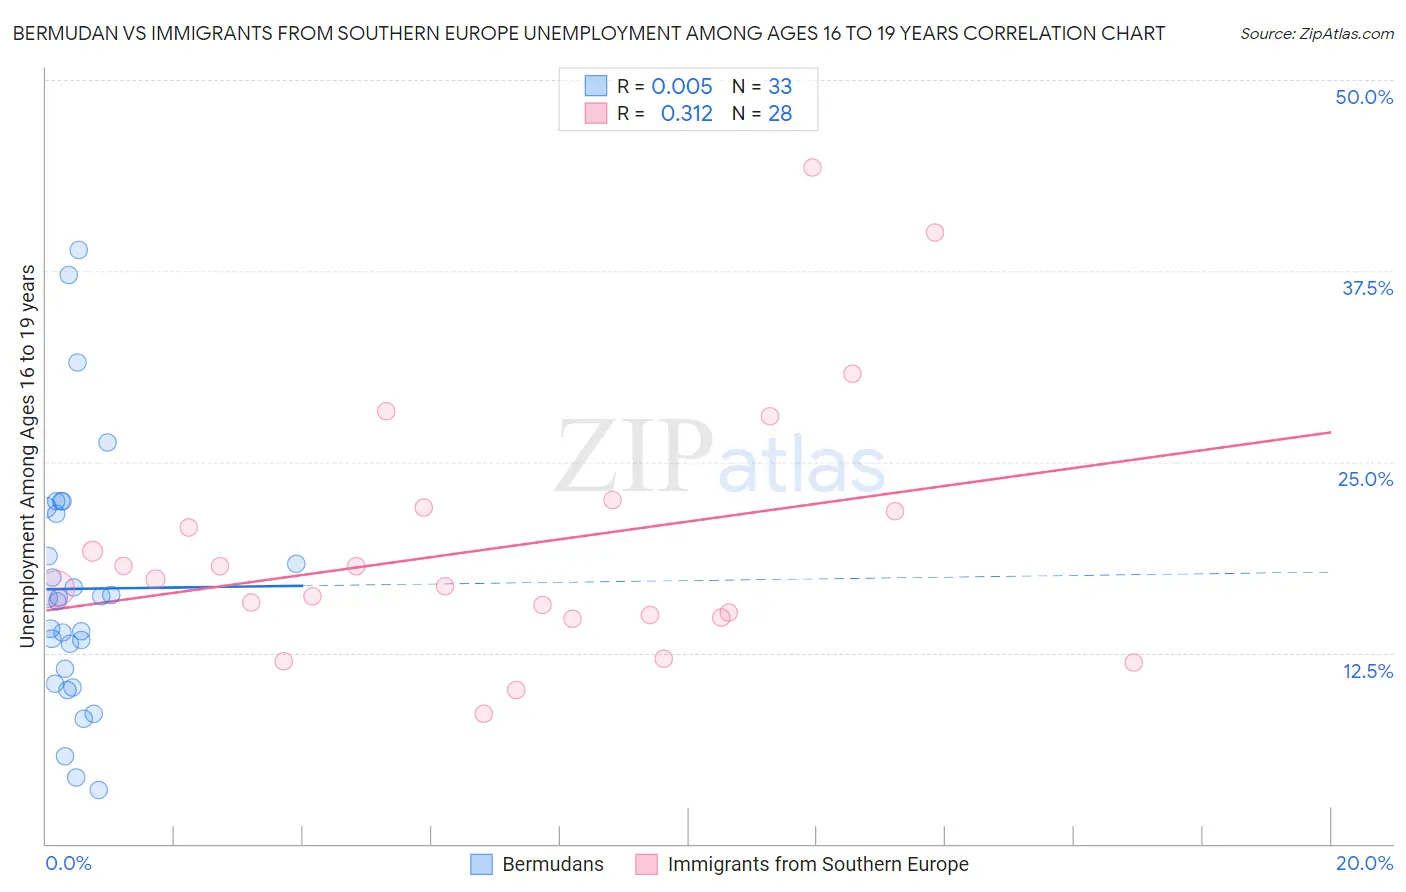
Bermudan vs Immigrants from Southern Europe Unemployment Among Ages 16 to 19 years Correlation Chart
The statistical analysis conducted on geographies consisting of 55,209,632 people shows no correlation between the proportion of Bermudans and unemployment rate among population between the ages 16 and 19 in the United States with a correlation coefficient (R) of 0.005 and weighted average of 17.6%. Similarly, the statistical analysis conducted on geographies consisting of 379,377,952 people shows a mild positive correlation between the proportion of Immigrants from Southern Europe and unemployment rate among population between the ages 16 and 19 in the United States with a correlation coefficient (R) of 0.312 and weighted average of 17.9%, a difference of 1.7%.
Unemployment Among Ages 16 to 19 years Correlation Summary
| Measurement | Bermudan | Immigrants from Southern Europe |
| Minimum | 3.5% | 8.5% |
| Maximum | 38.9% | 44.3% |
| Range | 35.4% | 35.8% |
| Mean | 16.7% | 19.5% |
| Median | 16.1% | 17.1% |
| Interquartile 25% (IQ1) | 10.9% | 14.9% |
| Interquartile 75% (IQ3) | 21.8% | 21.9% |
| Interquartile Range (IQR) | 10.9% | 7.0% |
| Standard Deviation (Sample) | 8.3% | 8.3% |
| Standard Deviation (Population) | 8.1% | 8.2% |
Similar Demographics by Unemployment Among Ages 16 to 19 years
Demographics Similar to Bermudans by Unemployment Among Ages 16 to 19 years
In terms of unemployment among ages 16 to 19 years, the demographic groups most similar to Bermudans are Celtic (17.6%, a difference of 0.0%), Nicaraguan (17.6%, a difference of 0.010%), Immigrants from Sweden (17.6%, a difference of 0.020%), Osage (17.6%, a difference of 0.060%), and American (17.6%, a difference of 0.060%).
| Demographics | Rating | Rank | Unemployment Among Ages 16 to 19 years |
| Immigrants | Romania | 53.3 /100 | #170 | Average 17.5% |
| Immigrants | Switzerland | 53.2 /100 | #171 | Average 17.5% |
| Immigrants | Western Europe | 52.2 /100 | #172 | Average 17.6% |
| Chileans | 50.8 /100 | #173 | Average 17.6% |
| Osage | 50.0 /100 | #174 | Average 17.6% |
| Immigrants | Sweden | 49.1 /100 | #175 | Average 17.6% |
| Nicaraguans | 48.9 /100 | #176 | Average 17.6% |
| Bermudans | 48.7 /100 | #177 | Average 17.6% |
| Celtics | 48.7 /100 | #178 | Average 17.6% |
| Americans | 47.4 /100 | #179 | Average 17.6% |
| Spaniards | 47.1 /100 | #180 | Average 17.6% |
| Immigrants | Turkey | 45.6 /100 | #181 | Average 17.6% |
| Russians | 45.2 /100 | #182 | Average 17.6% |
| Immigrants | Uruguay | 44.6 /100 | #183 | Average 17.6% |
| Eastern Europeans | 44.3 /100 | #184 | Average 17.6% |
Demographics Similar to Immigrants from Southern Europe by Unemployment Among Ages 16 to 19 years
In terms of unemployment among ages 16 to 19 years, the demographic groups most similar to Immigrants from Southern Europe are Liberian (17.9%, a difference of 0.020%), Assyrian/Chaldean/Syriac (17.9%, a difference of 0.14%), Nonimmigrants (17.9%, a difference of 0.15%), Hawaiian (17.9%, a difference of 0.17%), and Cherokee (17.9%, a difference of 0.26%).
| Demographics | Rating | Rank | Unemployment Among Ages 16 to 19 years |
| Immigrants | Ireland | 28.5 /100 | #199 | Fair 17.8% |
| Immigrants | Fiji | 27.7 /100 | #200 | Fair 17.8% |
| Immigrants | Ethiopia | 27.4 /100 | #201 | Fair 17.8% |
| Immigrants | Portugal | 27.2 /100 | #202 | Fair 17.8% |
| Immigrants | Eastern Europe | 23.6 /100 | #203 | Fair 17.8% |
| Immigrants | Nonimmigrants | 20.9 /100 | #204 | Fair 17.9% |
| Assyrians/Chaldeans/Syriacs | 20.8 /100 | #205 | Fair 17.9% |
| Immigrants | Southern Europe | 18.9 /100 | #206 | Poor 17.9% |
| Liberians | 18.6 /100 | #207 | Poor 17.9% |
| Hawaiians | 16.8 /100 | #208 | Poor 17.9% |
| Cherokee | 15.7 /100 | #209 | Poor 17.9% |
| Carpatho Rusyns | 15.6 /100 | #210 | Poor 17.9% |
| Guamanians/Chamorros | 14.5 /100 | #211 | Poor 17.9% |
| Argentineans | 13.8 /100 | #212 | Poor 18.0% |
| Chippewa | 13.7 /100 | #213 | Poor 18.0% |