Bermudan vs Immigrants from Peru Unemployment Among Seniors over 75 years
COMPARE
Bermudan
Immigrants from Peru
Unemployment Among Seniors over 75 years
Unemployment Among Seniors over 75 years Comparison
Bermudans
Immigrants from Peru
8.9%
UNEMPLOYMENT AMONG SENIORS OVER 75 YEARS
15.0/ 100
METRIC RATING
210th/ 347
METRIC RANK
8.9%
UNEMPLOYMENT AMONG SENIORS OVER 75 YEARS
24.3/ 100
METRIC RATING
201st/ 347
METRIC RANK
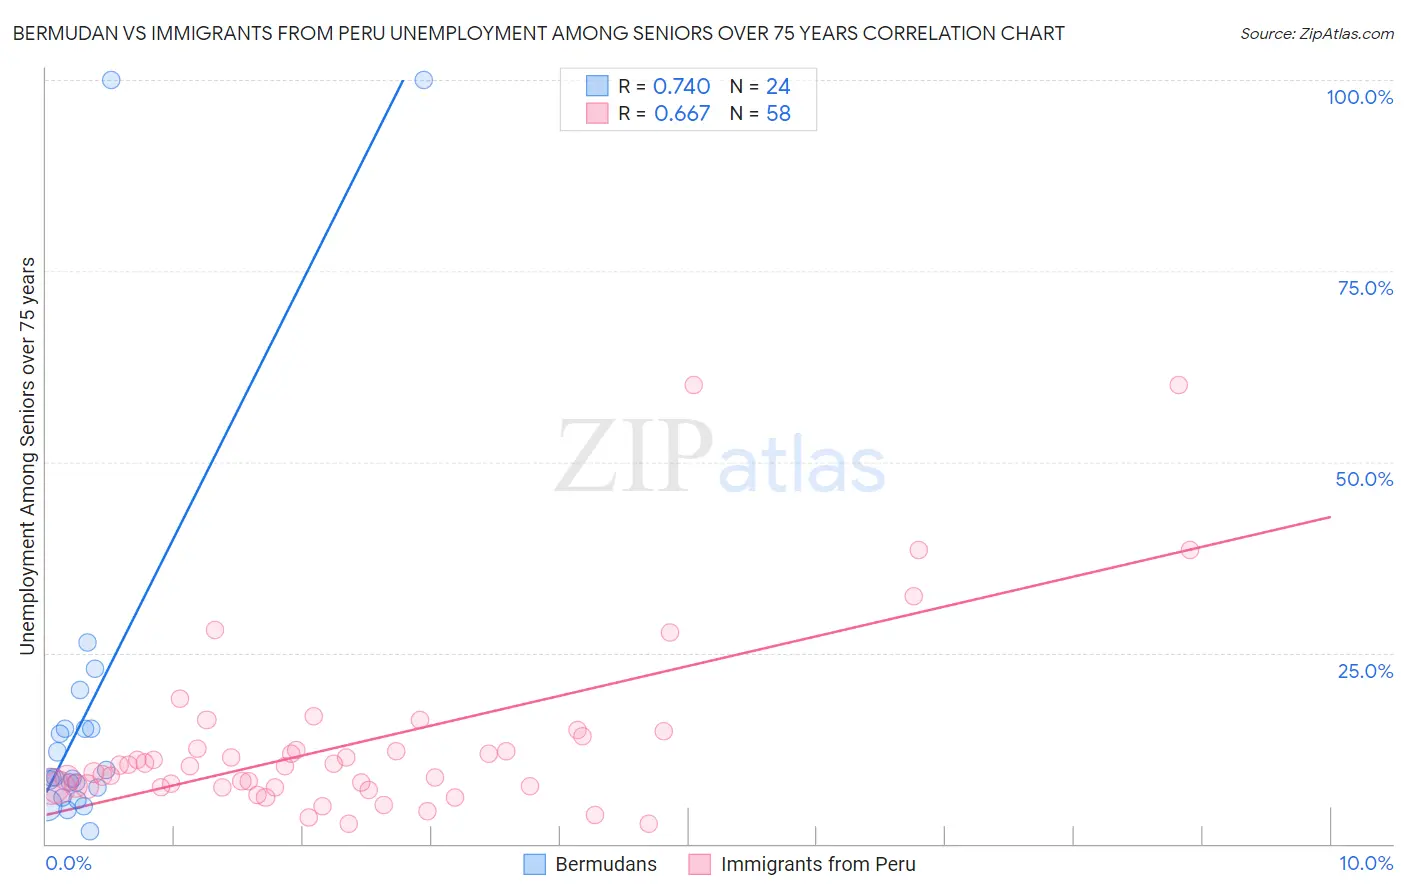
Bermudan vs Immigrants from Peru Unemployment Among Seniors over 75 years Correlation Chart
The statistical analysis conducted on geographies consisting of 46,839,817 people shows a strong positive correlation between the proportion of Bermudans and unemployment rate among seniors over the age of 75 in the United States with a correlation coefficient (R) of 0.740 and weighted average of 8.9%. Similarly, the statistical analysis conducted on geographies consisting of 181,477,141 people shows a significant positive correlation between the proportion of Immigrants from Peru and unemployment rate among seniors over the age of 75 in the United States with a correlation coefficient (R) of 0.667 and weighted average of 8.9%, a difference of 0.79%.
Unemployment Among Seniors over 75 years Correlation Summary
| Measurement | Bermudan | Immigrants from Peru |
| Minimum | 1.6% | 2.7% |
| Maximum | 100.0% | 60.0% |
| Range | 98.4% | 57.3% |
| Mean | 18.2% | 13.2% |
| Median | 8.7% | 10.2% |
| Interquartile 25% (IQ1) | 6.7% | 7.4% |
| Interquartile 75% (IQ3) | 15.1% | 12.5% |
| Interquartile Range (IQR) | 8.3% | 5.0% |
| Standard Deviation (Sample) | 25.9% | 11.7% |
| Standard Deviation (Population) | 25.4% | 11.6% |
Demographics Similar to Bermudans and Immigrants from Peru by Unemployment Among Seniors over 75 years
In terms of unemployment among seniors over 75 years, the demographic groups most similar to Bermudans are Salvadoran (8.9%, a difference of 0.040%), Delaware (9.0%, a difference of 0.050%), Immigrants from Philippines (8.9%, a difference of 0.080%), Malaysian (8.9%, a difference of 0.13%), and Romanian (9.0%, a difference of 0.13%). Similarly, the demographic groups most similar to Immigrants from Peru are Russian (8.9%, a difference of 0.010%), Immigrants from Northern Europe (8.9%, a difference of 0.030%), Pakistani (8.9%, a difference of 0.080%), Osage (8.9%, a difference of 0.080%), and Eastern European (8.9%, a difference of 0.11%).
| Demographics | Rating | Rank | Unemployment Among Seniors over 75 years |
| Okinawans | 28.9 /100 | #195 | Fair 8.8% |
| Immigrants | Jamaica | 27.7 /100 | #196 | Fair 8.9% |
| Immigrants | Laos | 26.3 /100 | #197 | Fair 8.9% |
| Eastern Europeans | 25.9 /100 | #198 | Fair 8.9% |
| Pakistanis | 25.4 /100 | #199 | Fair 8.9% |
| Osage | 25.4 /100 | #200 | Fair 8.9% |
| Immigrants | Peru | 24.3 /100 | #201 | Fair 8.9% |
| Russians | 24.1 /100 | #202 | Fair 8.9% |
| Immigrants | Northern Europe | 23.9 /100 | #203 | Fair 8.9% |
| Spaniards | 22.0 /100 | #204 | Fair 8.9% |
| Koreans | 21.9 /100 | #205 | Fair 8.9% |
| Immigrants | Western Europe | 18.2 /100 | #206 | Poor 8.9% |
| Malaysians | 16.3 /100 | #207 | Poor 8.9% |
| Immigrants | Philippines | 15.8 /100 | #208 | Poor 8.9% |
| Salvadorans | 15.4 /100 | #209 | Poor 8.9% |
| Bermudans | 15.0 /100 | #210 | Poor 8.9% |
| Delaware | 14.6 /100 | #211 | Poor 9.0% |
| Romanians | 13.8 /100 | #212 | Poor 9.0% |
| Immigrants | Latin America | 13.4 /100 | #213 | Poor 9.0% |
| Immigrants | Brazil | 13.3 /100 | #214 | Poor 9.0% |
| Immigrants | Western Asia | 12.5 /100 | #215 | Poor 9.0% |