Bermudan vs Belizean Unemployment Among Ages 30 to 34 years
COMPARE
Bermudan
Belizean
Unemployment Among Ages 30 to 34 years
Unemployment Among Ages 30 to 34 years Comparison
Bermudans
Belizeans
5.8%
UNEMPLOYMENT AMONG AGES 30 TO 34 YEARS
2.7/ 100
METRIC RATING
223rd/ 347
METRIC RANK
6.6%
UNEMPLOYMENT AMONG AGES 30 TO 34 YEARS
0.0/ 100
METRIC RATING
301st/ 347
METRIC RANK
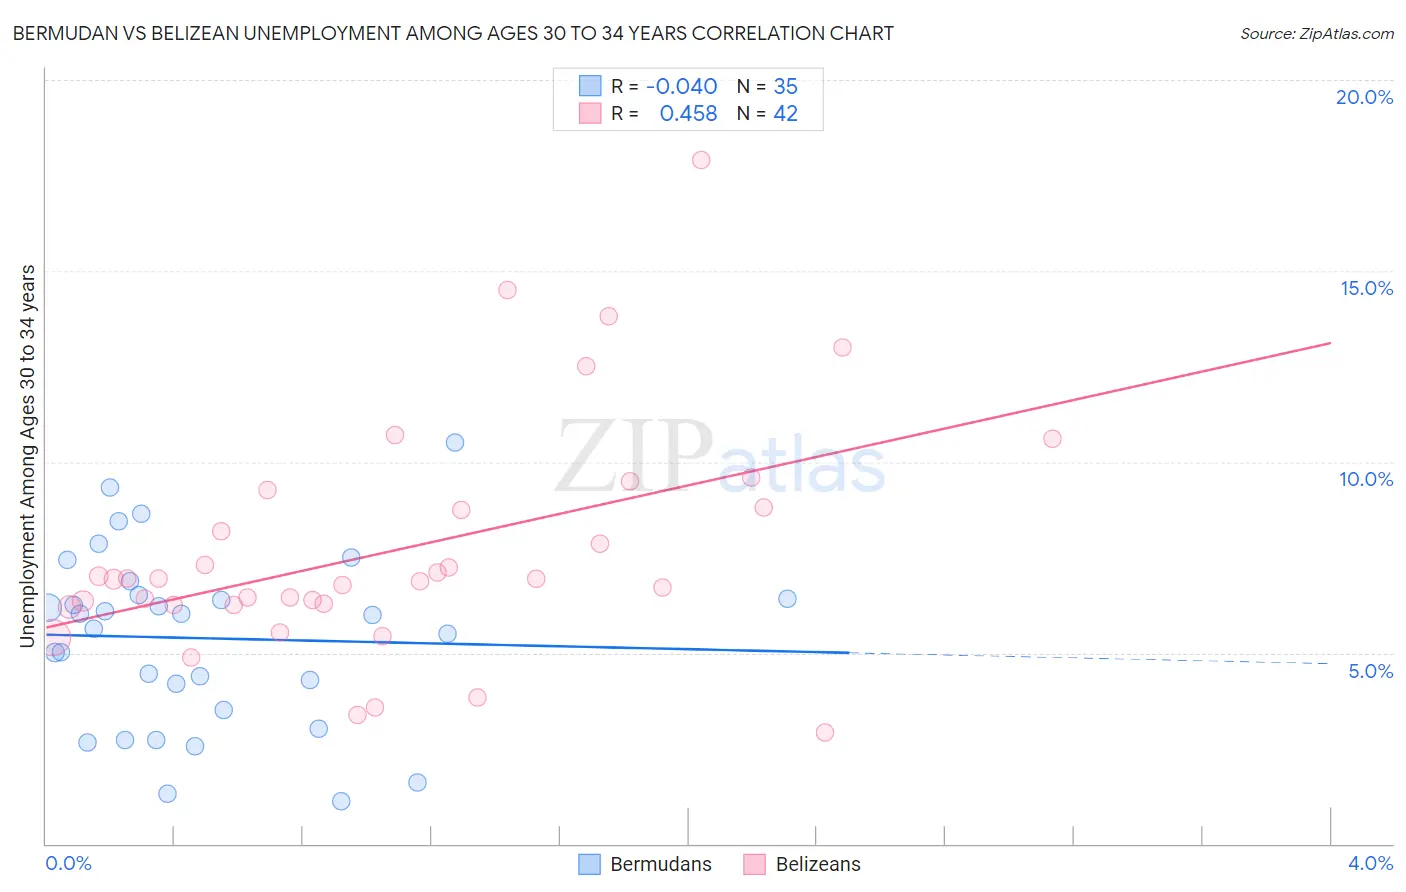
Bermudan vs Belizean Unemployment Among Ages 30 to 34 years Correlation Chart
The statistical analysis conducted on geographies consisting of 55,169,174 people shows no correlation between the proportion of Bermudans and unemployment rate among population between the ages 30 and 34 in the United States with a correlation coefficient (R) of -0.040 and weighted average of 5.8%. Similarly, the statistical analysis conducted on geographies consisting of 142,310,520 people shows a moderate positive correlation between the proportion of Belizeans and unemployment rate among population between the ages 30 and 34 in the United States with a correlation coefficient (R) of 0.458 and weighted average of 6.6%, a difference of 13.8%.
Unemployment Among Ages 30 to 34 years Correlation Summary
| Measurement | Bermudan | Belizean |
| Minimum | 1.1% | 2.9% |
| Maximum | 10.5% | 17.9% |
| Range | 9.4% | 15.0% |
| Mean | 5.4% | 7.7% |
| Median | 6.0% | 6.9% |
| Interquartile 25% (IQ1) | 3.5% | 6.3% |
| Interquartile 75% (IQ3) | 6.5% | 8.8% |
| Interquartile Range (IQR) | 3.0% | 2.5% |
| Standard Deviation (Sample) | 2.3% | 3.1% |
| Standard Deviation (Population) | 2.3% | 3.0% |
Similar Demographics by Unemployment Among Ages 30 to 34 years
Demographics Similar to Bermudans by Unemployment Among Ages 30 to 34 years
In terms of unemployment among ages 30 to 34 years, the demographic groups most similar to Bermudans are Slovak (5.8%, a difference of 0.15%), Samoan (5.8%, a difference of 0.17%), Spaniard (5.8%, a difference of 0.26%), Liberian (5.8%, a difference of 0.30%), and Guamanian/Chamorro (5.8%, a difference of 0.59%).
| Demographics | Rating | Rank | Unemployment Among Ages 30 to 34 years |
| Immigrants | Syria | 5.5 /100 | #216 | Tragic 5.7% |
| Immigrants | Fiji | 5.1 /100 | #217 | Tragic 5.7% |
| Panamanians | 4.5 /100 | #218 | Tragic 5.8% |
| French Canadians | 4.4 /100 | #219 | Tragic 5.8% |
| Sierra Leoneans | 3.9 /100 | #220 | Tragic 5.8% |
| Guamanians/Chamorros | 3.9 /100 | #221 | Tragic 5.8% |
| Spaniards | 3.2 /100 | #222 | Tragic 5.8% |
| Bermudans | 2.7 /100 | #223 | Tragic 5.8% |
| Slovaks | 2.5 /100 | #224 | Tragic 5.8% |
| Samoans | 2.5 /100 | #225 | Tragic 5.8% |
| Liberians | 2.3 /100 | #226 | Tragic 5.8% |
| Spanish | 1.8 /100 | #227 | Tragic 5.8% |
| Immigrants | Bahamas | 1.8 /100 | #228 | Tragic 5.8% |
| Immigrants | Uzbekistan | 1.5 /100 | #229 | Tragic 5.9% |
| Hawaiians | 1.2 /100 | #230 | Tragic 5.9% |
Demographics Similar to Belizeans by Unemployment Among Ages 30 to 34 years
In terms of unemployment among ages 30 to 34 years, the demographic groups most similar to Belizeans are Bahamian (6.6%, a difference of 0.29%), Dutch West Indian (6.6%, a difference of 0.34%), Immigrants from Barbados (6.6%, a difference of 0.44%), Creek (6.6%, a difference of 0.69%), and Immigrants from Jamaica (6.5%, a difference of 0.79%).
| Demographics | Rating | Rank | Unemployment Among Ages 30 to 34 years |
| Barbadians | 0.0 /100 | #294 | Tragic 6.5% |
| Trinidadians and Tobagonians | 0.0 /100 | #295 | Tragic 6.5% |
| Immigrants | Jamaica | 0.0 /100 | #296 | Tragic 6.5% |
| Creek | 0.0 /100 | #297 | Tragic 6.6% |
| Immigrants | Barbados | 0.0 /100 | #298 | Tragic 6.6% |
| Dutch West Indians | 0.0 /100 | #299 | Tragic 6.6% |
| Bahamians | 0.0 /100 | #300 | Tragic 6.6% |
| Belizeans | 0.0 /100 | #301 | Tragic 6.6% |
| Delaware | 0.0 /100 | #302 | Tragic 6.7% |
| Cajuns | 0.0 /100 | #303 | Tragic 6.7% |
| Kiowa | 0.0 /100 | #304 | Tragic 6.7% |
| Paiute | 0.0 /100 | #305 | Tragic 6.7% |
| Immigrants | Armenia | 0.0 /100 | #306 | Tragic 6.8% |
| Immigrants | Belize | 0.0 /100 | #307 | Tragic 6.9% |
| Immigrants | Azores | 0.0 /100 | #308 | Tragic 6.9% |