Belizean vs Chilean Unemployment Among Ages 45 to 54 years
COMPARE
Belizean
Chilean
Unemployment Among Ages 45 to 54 years
Unemployment Among Ages 45 to 54 years Comparison
Belizeans
Chileans
5.2%
UNEMPLOYMENT AMONG AGES 45 TO 54 YEARS
0.0/ 100
METRIC RATING
294th/ 347
METRIC RANK
4.3%
UNEMPLOYMENT AMONG AGES 45 TO 54 YEARS
98.1/ 100
METRIC RATING
77th/ 347
METRIC RANK
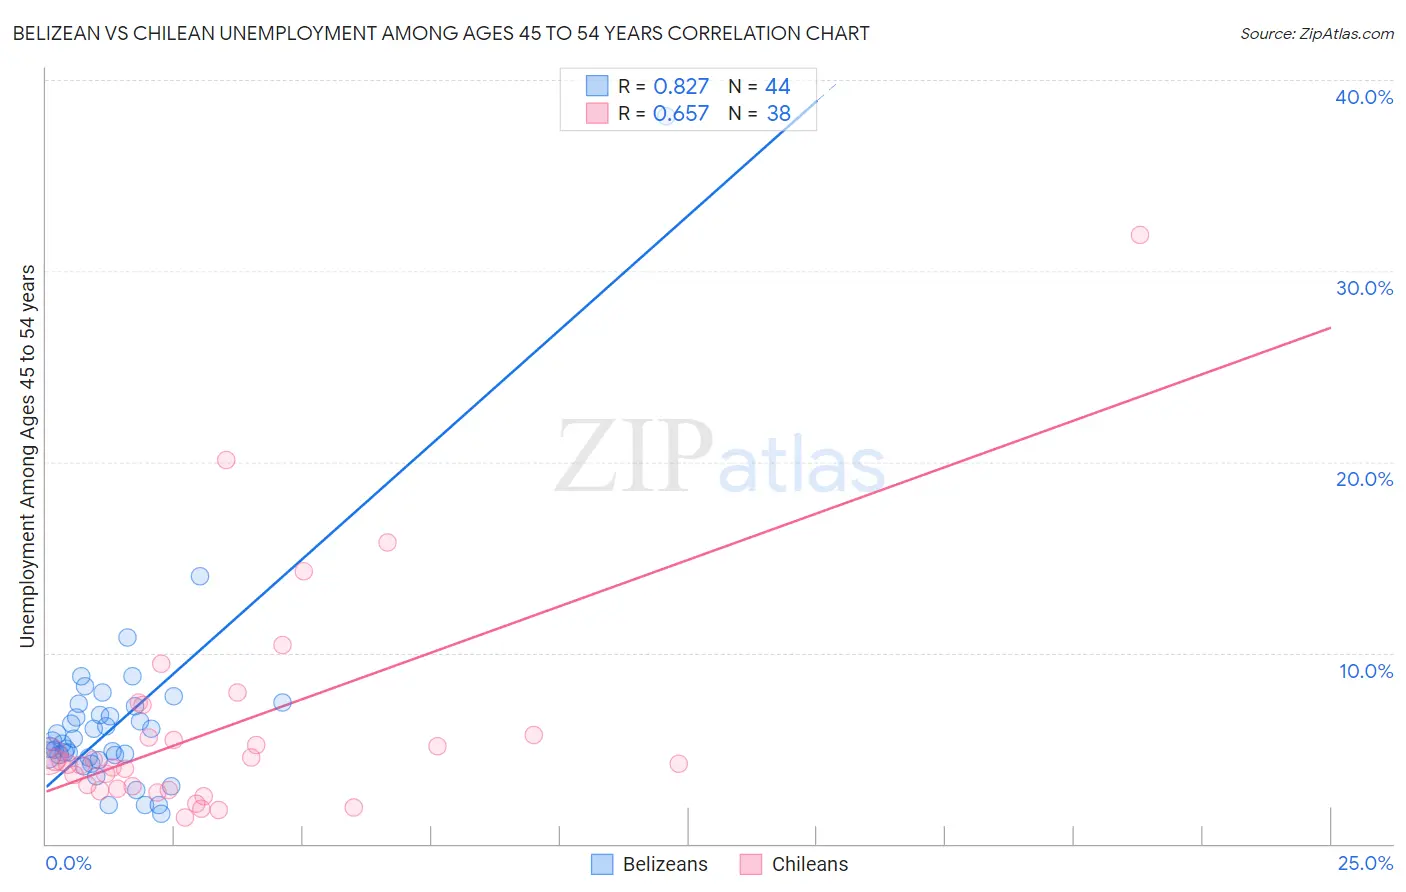
Belizean vs Chilean Unemployment Among Ages 45 to 54 years Correlation Chart
The statistical analysis conducted on geographies consisting of 143,356,931 people shows a very strong positive correlation between the proportion of Belizeans and unemployment rate among population between the ages 45 and 54 in the United States with a correlation coefficient (R) of 0.827 and weighted average of 5.2%. Similarly, the statistical analysis conducted on geographies consisting of 253,659,232 people shows a significant positive correlation between the proportion of Chileans and unemployment rate among population between the ages 45 and 54 in the United States with a correlation coefficient (R) of 0.657 and weighted average of 4.3%, a difference of 21.6%.
Unemployment Among Ages 45 to 54 years Correlation Summary
| Measurement | Belizean | Chilean |
| Minimum | 1.6% | 1.4% |
| Maximum | 38.1% | 31.9% |
| Range | 36.5% | 30.5% |
| Mean | 6.4% | 6.1% |
| Median | 5.3% | 4.3% |
| Interquartile 25% (IQ1) | 4.6% | 2.9% |
| Interquartile 75% (IQ3) | 7.0% | 5.7% |
| Interquartile Range (IQR) | 2.4% | 2.8% |
| Standard Deviation (Sample) | 5.4% | 5.9% |
| Standard Deviation (Population) | 5.4% | 5.8% |
Similar Demographics by Unemployment Among Ages 45 to 54 years
Demographics Similar to Belizeans by Unemployment Among Ages 45 to 54 years
In terms of unemployment among ages 45 to 54 years, the demographic groups most similar to Belizeans are Jamaican (5.3%, a difference of 0.15%), Aleut (5.3%, a difference of 0.33%), West Indian (5.3%, a difference of 0.34%), Immigrants from Trinidad and Tobago (5.3%, a difference of 0.46%), and Ecuadorian (5.3%, a difference of 0.48%).
| Demographics | Rating | Rank | Unemployment Among Ages 45 to 54 years |
| Haitians | 0.0 /100 | #287 | Tragic 5.2% |
| Immigrants | Caribbean | 0.0 /100 | #288 | Tragic 5.2% |
| Immigrants | Haiti | 0.0 /100 | #289 | Tragic 5.2% |
| Immigrants | Portugal | 0.0 /100 | #290 | Tragic 5.2% |
| Armenians | 0.0 /100 | #291 | Tragic 5.2% |
| Trinidadians and Tobagonians | 0.0 /100 | #292 | Tragic 5.2% |
| Immigrants | Senegal | 0.0 /100 | #293 | Tragic 5.2% |
| Belizeans | 0.0 /100 | #294 | Tragic 5.2% |
| Jamaicans | 0.0 /100 | #295 | Tragic 5.3% |
| Aleuts | 0.0 /100 | #296 | Tragic 5.3% |
| West Indians | 0.0 /100 | #297 | Tragic 5.3% |
| Immigrants | Trinidad and Tobago | 0.0 /100 | #298 | Tragic 5.3% |
| Ecuadorians | 0.0 /100 | #299 | Tragic 5.3% |
| Central American Indians | 0.0 /100 | #300 | Tragic 5.3% |
| Menominee | 0.0 /100 | #301 | Tragic 5.3% |
Demographics Similar to Chileans by Unemployment Among Ages 45 to 54 years
In terms of unemployment among ages 45 to 54 years, the demographic groups most similar to Chileans are Slavic (4.3%, a difference of 0.050%), Kenyan (4.3%, a difference of 0.060%), Immigrants from Belgium (4.3%, a difference of 0.090%), German Russian (4.3%, a difference of 0.090%), and Serbian (4.3%, a difference of 0.090%).
| Demographics | Rating | Rank | Unemployment Among Ages 45 to 54 years |
| Paraguayans | 98.6 /100 | #70 | Exceptional 4.3% |
| Palestinians | 98.5 /100 | #71 | Exceptional 4.3% |
| Whites/Caucasians | 98.4 /100 | #72 | Exceptional 4.3% |
| Canadians | 98.2 /100 | #73 | Exceptional 4.3% |
| Immigrants | Belgium | 98.2 /100 | #74 | Exceptional 4.3% |
| Kenyans | 98.1 /100 | #75 | Exceptional 4.3% |
| Slavs | 98.1 /100 | #76 | Exceptional 4.3% |
| Chileans | 98.1 /100 | #77 | Exceptional 4.3% |
| German Russians | 97.9 /100 | #78 | Exceptional 4.3% |
| Serbians | 97.9 /100 | #79 | Exceptional 4.3% |
| Cambodians | 97.8 /100 | #80 | Exceptional 4.3% |
| Immigrants | Micronesia | 97.6 /100 | #81 | Exceptional 4.3% |
| Eastern Europeans | 97.6 /100 | #82 | Exceptional 4.3% |
| Australians | 97.4 /100 | #83 | Exceptional 4.3% |
| Italians | 97.3 /100 | #84 | Exceptional 4.3% |