Belizean vs Canadian Unemployment Among Ages 60 to 64 years
COMPARE
Belizean
Canadian
Unemployment Among Ages 60 to 64 years
Unemployment Among Ages 60 to 64 years Comparison
Belizeans
Canadians
5.5%
UNEMPLOYMENT AMONG AGES 60 TO 64 YEARS
0.0/ 100
METRIC RATING
313th/ 347
METRIC RANK
4.7%
UNEMPLOYMENT AMONG AGES 60 TO 64 YEARS
97.7/ 100
METRIC RATING
105th/ 347
METRIC RANK
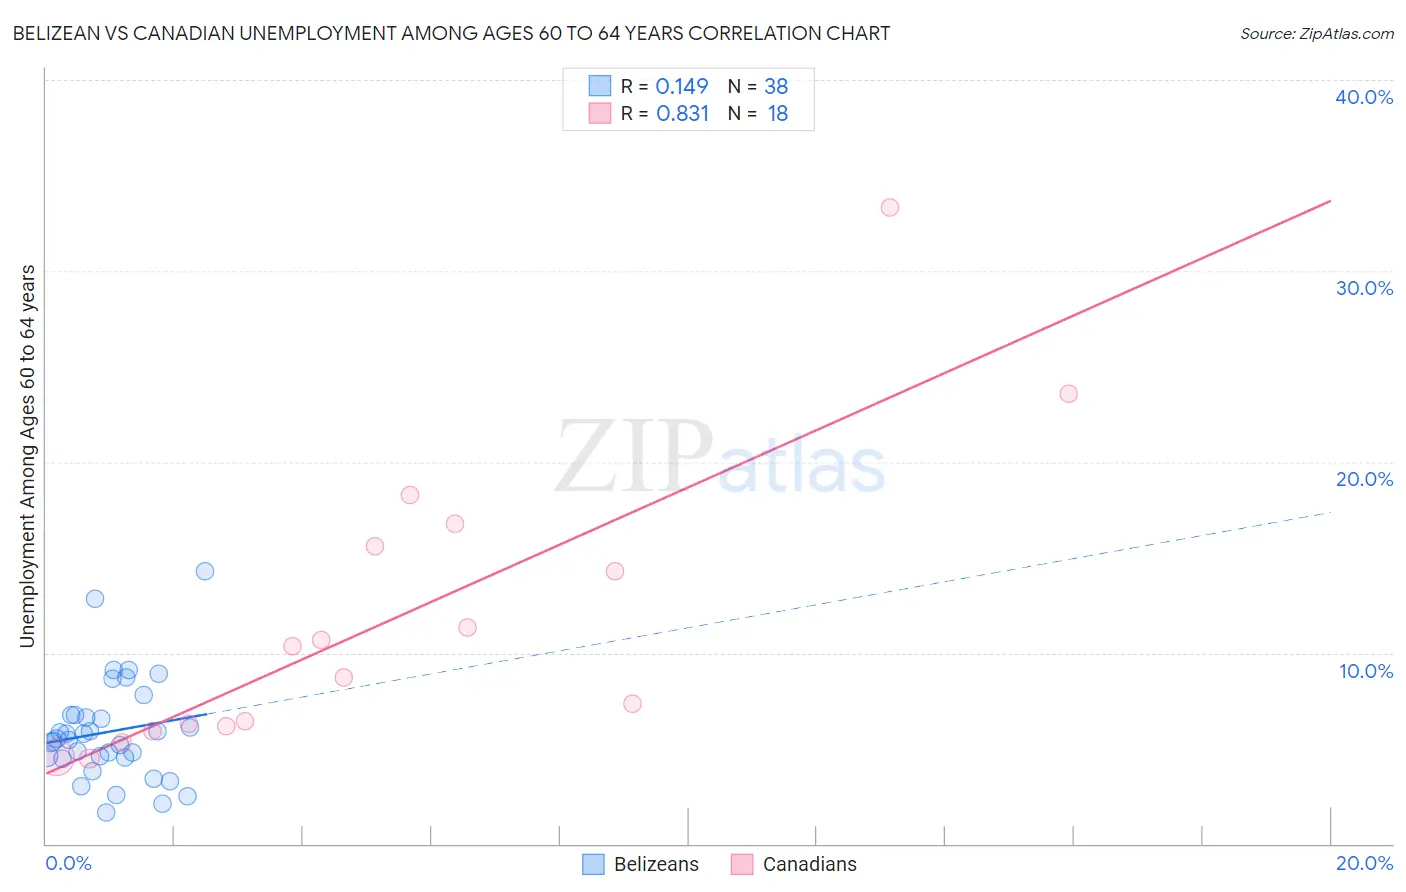
Belizean vs Canadian Unemployment Among Ages 60 to 64 years Correlation Chart
The statistical analysis conducted on geographies consisting of 139,664,950 people shows a poor positive correlation between the proportion of Belizeans and unemployment rate among population between the ages 60 and 64 in the United States with a correlation coefficient (R) of 0.149 and weighted average of 5.5%. Similarly, the statistical analysis conducted on geographies consisting of 386,831,293 people shows a very strong positive correlation between the proportion of Canadians and unemployment rate among population between the ages 60 and 64 in the United States with a correlation coefficient (R) of 0.831 and weighted average of 4.7%, a difference of 17.3%.
Unemployment Among Ages 60 to 64 years Correlation Summary
| Measurement | Belizean | Canadian |
| Minimum | 1.6% | 4.5% |
| Maximum | 14.3% | 33.3% |
| Range | 12.7% | 28.8% |
| Mean | 5.9% | 11.6% |
| Median | 5.5% | 9.5% |
| Interquartile 25% (IQ1) | 4.5% | 6.1% |
| Interquartile 75% (IQ3) | 6.7% | 15.6% |
| Interquartile Range (IQR) | 2.2% | 9.4% |
| Standard Deviation (Sample) | 2.7% | 7.7% |
| Standard Deviation (Population) | 2.6% | 7.4% |
Similar Demographics by Unemployment Among Ages 60 to 64 years
Demographics Similar to Belizeans by Unemployment Among Ages 60 to 64 years
In terms of unemployment among ages 60 to 64 years, the demographic groups most similar to Belizeans are Guyanese (5.5%, a difference of 0.17%), Immigrants from West Indies (5.5%, a difference of 0.70%), U.S. Virgin Islander (5.5%, a difference of 0.89%), British West Indian (5.5%, a difference of 0.90%), and Cree (5.6%, a difference of 1.5%).
| Demographics | Rating | Rank | Unemployment Among Ages 60 to 64 years |
| Immigrants | Dominica | 0.0 /100 | #306 | Tragic 5.4% |
| Immigrants | Guyana | 0.0 /100 | #307 | Tragic 5.4% |
| Spanish American Indians | 0.0 /100 | #308 | Tragic 5.4% |
| Soviet Union | 0.0 /100 | #309 | Tragic 5.4% |
| British West Indians | 0.0 /100 | #310 | Tragic 5.5% |
| U.S. Virgin Islanders | 0.0 /100 | #311 | Tragic 5.5% |
| Immigrants | West Indies | 0.0 /100 | #312 | Tragic 5.5% |
| Belizeans | 0.0 /100 | #313 | Tragic 5.5% |
| Guyanese | 0.0 /100 | #314 | Tragic 5.5% |
| Cree | 0.0 /100 | #315 | Tragic 5.6% |
| Cheyenne | 0.0 /100 | #316 | Tragic 5.6% |
| Shoshone | 0.0 /100 | #317 | Tragic 5.7% |
| Natives/Alaskans | 0.0 /100 | #318 | Tragic 5.7% |
| Immigrants | Belize | 0.0 /100 | #319 | Tragic 5.7% |
| Colville | 0.0 /100 | #320 | Tragic 5.7% |
Demographics Similar to Canadians by Unemployment Among Ages 60 to 64 years
In terms of unemployment among ages 60 to 64 years, the demographic groups most similar to Canadians are Paraguayan (4.7%, a difference of 0.030%), Immigrants from North America (4.7%, a difference of 0.030%), Greek (4.7%, a difference of 0.040%), White/Caucasian (4.7%, a difference of 0.070%), and Immigrants from Canada (4.7%, a difference of 0.080%).
| Demographics | Rating | Rank | Unemployment Among Ages 60 to 64 years |
| Somalis | 98.0 /100 | #98 | Exceptional 4.7% |
| Egyptians | 98.0 /100 | #99 | Exceptional 4.7% |
| Portuguese | 97.9 /100 | #100 | Exceptional 4.7% |
| Malaysians | 97.9 /100 | #101 | Exceptional 4.7% |
| Immigrants | Canada | 97.8 /100 | #102 | Exceptional 4.7% |
| Whites/Caucasians | 97.8 /100 | #103 | Exceptional 4.7% |
| Paraguayans | 97.7 /100 | #104 | Exceptional 4.7% |
| Canadians | 97.7 /100 | #105 | Exceptional 4.7% |
| Immigrants | North America | 97.6 /100 | #106 | Exceptional 4.7% |
| Greeks | 97.5 /100 | #107 | Exceptional 4.7% |
| Immigrants | Japan | 97.4 /100 | #108 | Exceptional 4.7% |
| Immigrants | Netherlands | 97.4 /100 | #109 | Exceptional 4.7% |
| Ethiopians | 97.2 /100 | #110 | Exceptional 4.7% |
| French | 97.1 /100 | #111 | Exceptional 4.7% |
| Syrians | 97.0 /100 | #112 | Exceptional 4.7% |