Belgian vs Samoan Female Unemployment
COMPARE
Belgian
Samoan
Female Unemployment
Female Unemployment Comparison
Belgians
Samoans
4.6%
FEMALE UNEMPLOYMENT
100.0/ 100
METRIC RATING
13th/ 347
METRIC RANK
5.4%
FEMALE UNEMPLOYMENT
10.6/ 100
METRIC RATING
213th/ 347
METRIC RANK
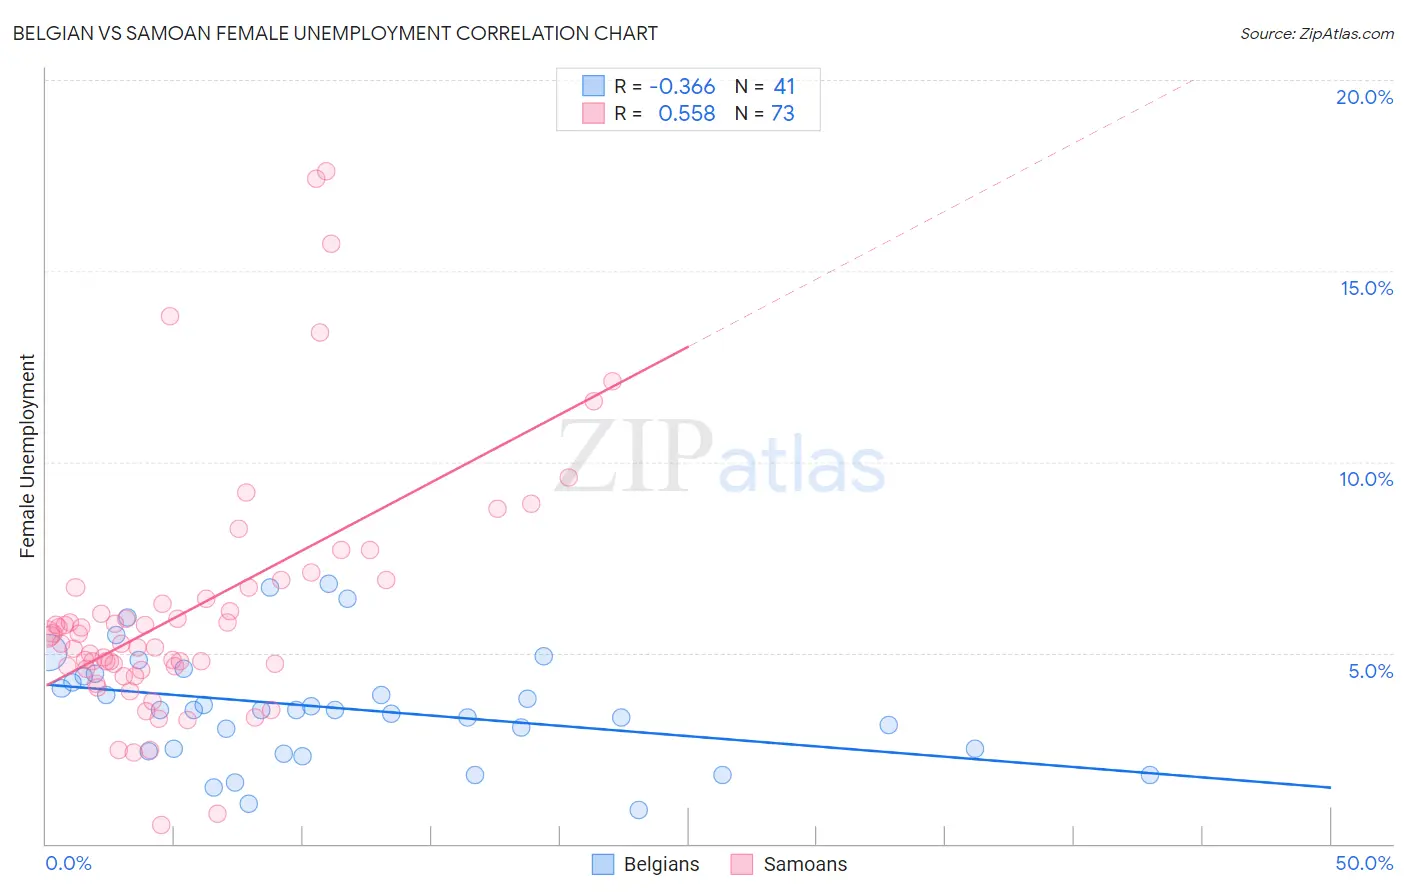
Belgian vs Samoan Female Unemployment Correlation Chart
The statistical analysis conducted on geographies consisting of 353,426,592 people shows a mild negative correlation between the proportion of Belgians and unemploymnet rate among females in the United States with a correlation coefficient (R) of -0.366 and weighted average of 4.6%. Similarly, the statistical analysis conducted on geographies consisting of 224,572,142 people shows a substantial positive correlation between the proportion of Samoans and unemploymnet rate among females in the United States with a correlation coefficient (R) of 0.558 and weighted average of 5.4%, a difference of 18.0%.
Female Unemployment Correlation Summary
| Measurement | Belgian | Samoan |
| Minimum | 0.90% | 0.50% |
| Maximum | 6.8% | 17.6% |
| Range | 5.9% | 17.1% |
| Mean | 3.6% | 6.1% |
| Median | 3.5% | 5.4% |
| Interquartile 25% (IQ1) | 2.4% | 4.6% |
| Interquartile 75% (IQ3) | 4.4% | 6.7% |
| Interquartile Range (IQR) | 2.0% | 2.1% |
| Standard Deviation (Sample) | 1.5% | 3.3% |
| Standard Deviation (Population) | 1.4% | 3.3% |
Similar Demographics by Female Unemployment
Demographics Similar to Belgians by Female Unemployment
In terms of female unemployment, the demographic groups most similar to Belgians are Dutch (4.6%, a difference of 0.15%), Finnish (4.6%, a difference of 0.59%), Scandinavian (4.6%, a difference of 0.75%), English (4.6%, a difference of 0.79%), and Swiss (4.6%, a difference of 0.86%).
| Demographics | Rating | Rank | Female Unemployment |
| Swedes | 100.0 /100 | #6 | Exceptional 4.4% |
| Chinese | 100.0 /100 | #7 | Exceptional 4.5% |
| Germans | 100.0 /100 | #8 | Exceptional 4.5% |
| Slovenes | 100.0 /100 | #9 | Exceptional 4.5% |
| Swiss | 100.0 /100 | #10 | Exceptional 4.6% |
| Scandinavians | 100.0 /100 | #11 | Exceptional 4.6% |
| Dutch | 100.0 /100 | #12 | Exceptional 4.6% |
| Belgians | 100.0 /100 | #13 | Exceptional 4.6% |
| Finns | 100.0 /100 | #14 | Exceptional 4.6% |
| English | 100.0 /100 | #15 | Exceptional 4.6% |
| Carpatho Rusyns | 99.9 /100 | #16 | Exceptional 4.7% |
| Croatians | 99.9 /100 | #17 | Exceptional 4.7% |
| Latvians | 99.9 /100 | #18 | Exceptional 4.7% |
| Poles | 99.9 /100 | #19 | Exceptional 4.7% |
| Bulgarians | 99.9 /100 | #20 | Exceptional 4.7% |
Demographics Similar to Samoans by Female Unemployment
In terms of female unemployment, the demographic groups most similar to Samoans are Seminole (5.4%, a difference of 0.050%), Immigrants from Nicaragua (5.4%, a difference of 0.070%), Comanche (5.4%, a difference of 0.090%), Uruguayan (5.4%, a difference of 0.12%), and Ottawa (5.4%, a difference of 0.14%).
| Demographics | Rating | Rank | Female Unemployment |
| Immigrants | Brazil | 18.8 /100 | #206 | Poor 5.4% |
| Creek | 15.4 /100 | #207 | Poor 5.4% |
| Immigrants | Costa Rica | 13.7 /100 | #208 | Poor 5.4% |
| Koreans | 13.4 /100 | #209 | Poor 5.4% |
| Choctaw | 12.3 /100 | #210 | Poor 5.4% |
| Ottawa | 11.6 /100 | #211 | Poor 5.4% |
| Uruguayans | 11.4 /100 | #212 | Poor 5.4% |
| Samoans | 10.6 /100 | #213 | Poor 5.4% |
| Seminole | 10.3 /100 | #214 | Poor 5.4% |
| Immigrants | Nicaragua | 10.2 /100 | #215 | Poor 5.4% |
| Comanche | 10.0 /100 | #216 | Poor 5.4% |
| Peruvians | 9.6 /100 | #217 | Tragic 5.4% |
| Bermudans | 9.0 /100 | #218 | Tragic 5.4% |
| South Americans | 8.6 /100 | #219 | Tragic 5.4% |
| Immigrants | Africa | 8.5 /100 | #220 | Tragic 5.4% |