Belgian vs Mexican Unemployment Among Ages 60 to 64 years
COMPARE
Belgian
Mexican
Unemployment Among Ages 60 to 64 years
Unemployment Among Ages 60 to 64 years Comparison
Belgians
Mexicans
4.5%
UNEMPLOYMENT AMONG AGES 60 TO 64 YEARS
100.0/ 100
METRIC RATING
34th/ 347
METRIC RANK
5.2%
UNEMPLOYMENT AMONG AGES 60 TO 64 YEARS
0.0/ 100
METRIC RATING
282nd/ 347
METRIC RANK
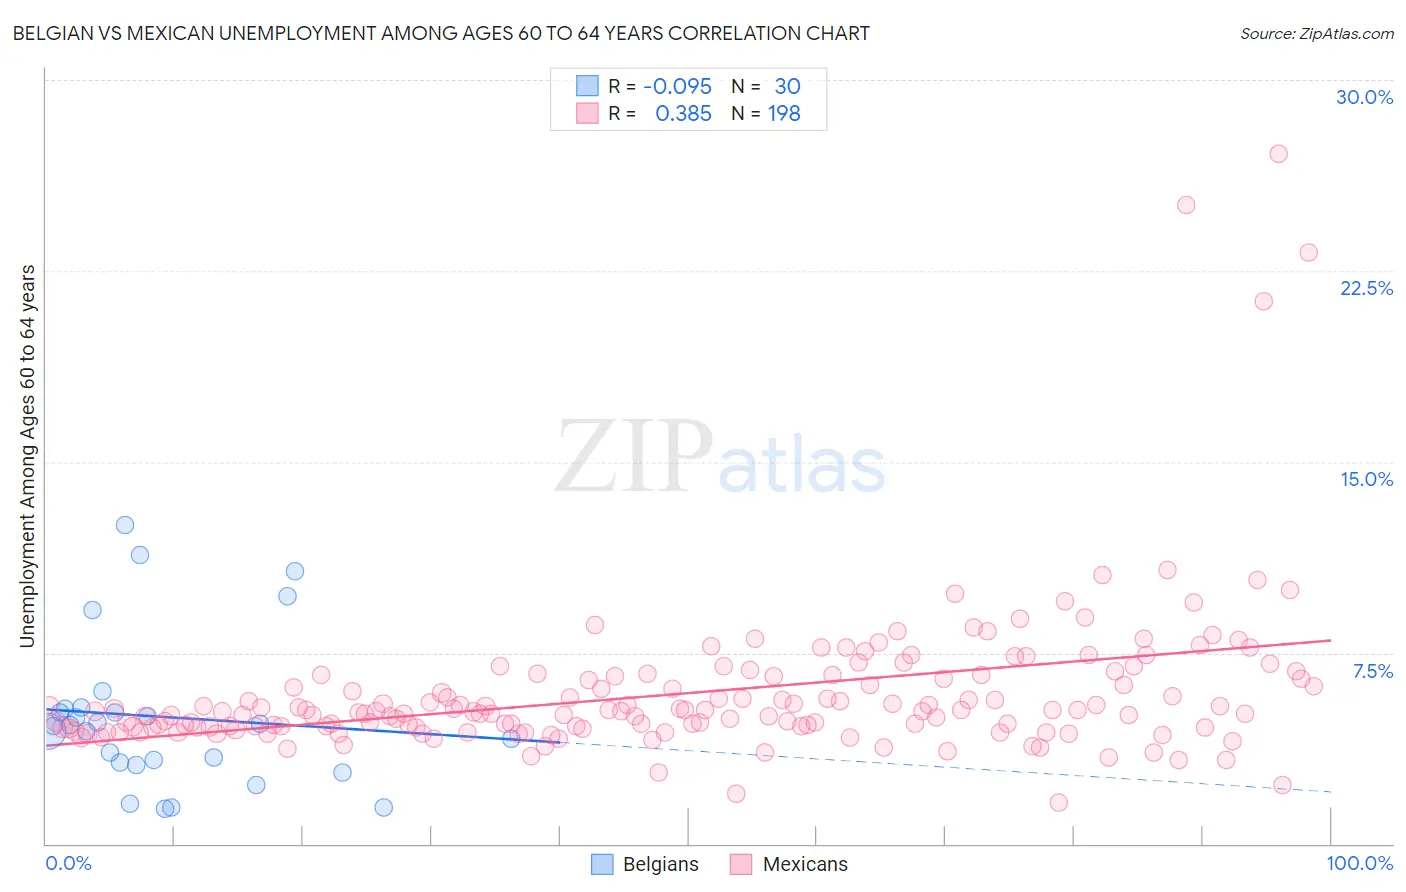
Belgian vs Mexican Unemployment Among Ages 60 to 64 years Correlation Chart
The statistical analysis conducted on geographies consisting of 318,582,400 people shows a slight negative correlation between the proportion of Belgians and unemployment rate among population between the ages 60 and 64 in the United States with a correlation coefficient (R) of -0.095 and weighted average of 4.5%. Similarly, the statistical analysis conducted on geographies consisting of 464,555,548 people shows a mild positive correlation between the proportion of Mexicans and unemployment rate among population between the ages 60 and 64 in the United States with a correlation coefficient (R) of 0.385 and weighted average of 5.2%, a difference of 16.7%.
Unemployment Among Ages 60 to 64 years Correlation Summary
| Measurement | Belgian | Mexican |
| Minimum | 1.4% | 1.6% |
| Maximum | 12.5% | 27.1% |
| Range | 11.1% | 25.5% |
| Mean | 5.0% | 5.9% |
| Median | 4.6% | 5.2% |
| Interquartile 25% (IQ1) | 3.2% | 4.6% |
| Interquartile 75% (IQ3) | 5.3% | 6.5% |
| Interquartile Range (IQR) | 2.1% | 1.9% |
| Standard Deviation (Sample) | 2.9% | 3.1% |
| Standard Deviation (Population) | 2.9% | 3.1% |
Similar Demographics by Unemployment Among Ages 60 to 64 years
Demographics Similar to Belgians by Unemployment Among Ages 60 to 64 years
In terms of unemployment among ages 60 to 64 years, the demographic groups most similar to Belgians are German (4.5%, a difference of 0.020%), Venezuelan (4.5%, a difference of 0.030%), Immigrants from Portugal (4.5%, a difference of 0.060%), Carpatho Rusyn (4.5%, a difference of 0.26%), and Native Hawaiian (4.5%, a difference of 0.26%).
| Demographics | Rating | Rank | Unemployment Among Ages 60 to 64 years |
| Immigrants | Iraq | 100.0 /100 | #27 | Exceptional 4.5% |
| Immigrants | Nepal | 100.0 /100 | #28 | Exceptional 4.5% |
| Cubans | 100.0 /100 | #29 | Exceptional 4.5% |
| Immigrants | Venezuela | 100.0 /100 | #30 | Exceptional 4.5% |
| Immigrants | Eritrea | 100.0 /100 | #31 | Exceptional 4.5% |
| Zimbabweans | 100.0 /100 | #32 | Exceptional 4.5% |
| Carpatho Rusyns | 100.0 /100 | #33 | Exceptional 4.5% |
| Belgians | 100.0 /100 | #34 | Exceptional 4.5% |
| Germans | 100.0 /100 | #35 | Exceptional 4.5% |
| Venezuelans | 100.0 /100 | #36 | Exceptional 4.5% |
| Immigrants | Portugal | 100.0 /100 | #37 | Exceptional 4.5% |
| Native Hawaiians | 100.0 /100 | #38 | Exceptional 4.5% |
| Iraqis | 100.0 /100 | #39 | Exceptional 4.5% |
| Scandinavians | 100.0 /100 | #40 | Exceptional 4.5% |
| Immigrants | Sudan | 100.0 /100 | #41 | Exceptional 4.5% |
Demographics Similar to Mexicans by Unemployment Among Ages 60 to 64 years
In terms of unemployment among ages 60 to 64 years, the demographic groups most similar to Mexicans are Immigrants from Haiti (5.2%, a difference of 0.0%), Nepalese (5.2%, a difference of 0.050%), French American Indian (5.2%, a difference of 0.050%), Guatemalan (5.2%, a difference of 0.25%), and Immigrants from Guatemala (5.3%, a difference of 0.43%).
| Demographics | Rating | Rank | Unemployment Among Ages 60 to 64 years |
| Immigrants | Hong Kong | 0.1 /100 | #275 | Tragic 5.2% |
| Central Americans | 0.0 /100 | #276 | Tragic 5.2% |
| Immigrants | Caribbean | 0.0 /100 | #277 | Tragic 5.2% |
| Guatemalans | 0.0 /100 | #278 | Tragic 5.2% |
| Nepalese | 0.0 /100 | #279 | Tragic 5.2% |
| French American Indians | 0.0 /100 | #280 | Tragic 5.2% |
| Immigrants | Haiti | 0.0 /100 | #281 | Tragic 5.2% |
| Mexicans | 0.0 /100 | #282 | Tragic 5.2% |
| Immigrants | Guatemala | 0.0 /100 | #283 | Tragic 5.3% |
| Taiwanese | 0.0 /100 | #284 | Tragic 5.3% |
| West Indians | 0.0 /100 | #285 | Tragic 5.3% |
| Mexican American Indians | 0.0 /100 | #286 | Tragic 5.3% |
| Salvadorans | 0.0 /100 | #287 | Tragic 5.3% |
| Trinidadians and Tobagonians | 0.0 /100 | #288 | Tragic 5.3% |
| Spanish Americans | 0.0 /100 | #289 | Tragic 5.3% |