Belgian vs Immigrants from Nigeria Unemployment Among Ages 45 to 54 years
COMPARE
Belgian
Immigrants from Nigeria
Unemployment Among Ages 45 to 54 years
Unemployment Among Ages 45 to 54 years Comparison
Belgians
Immigrants from Nigeria
4.1%
UNEMPLOYMENT AMONG AGES 45 TO 54 YEARS
99.9/ 100
METRIC RATING
29th/ 347
METRIC RANK
4.6%
UNEMPLOYMENT AMONG AGES 45 TO 54 YEARS
13.3/ 100
METRIC RATING
209th/ 347
METRIC RANK
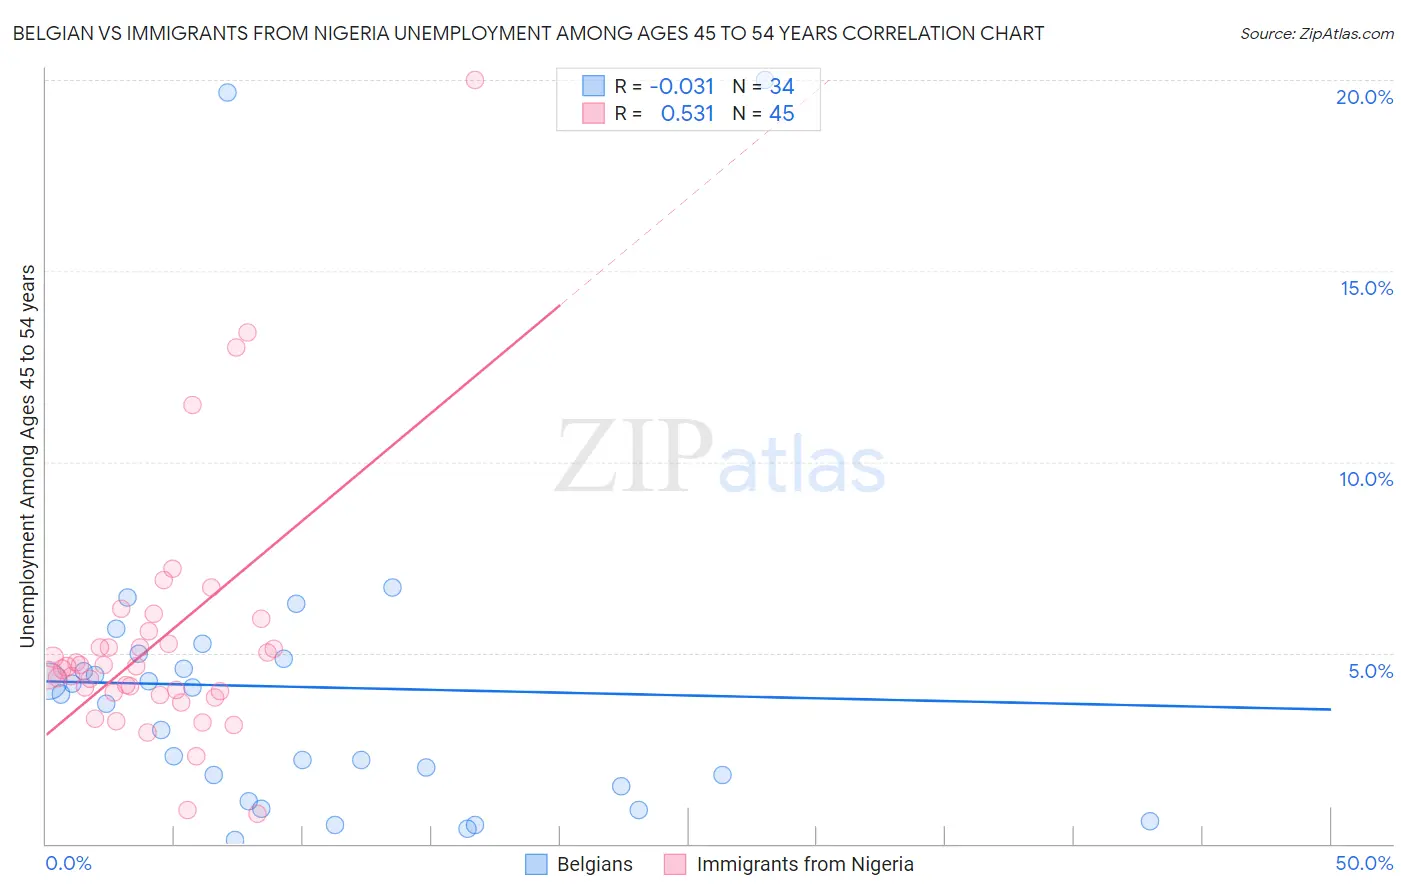
Belgian vs Immigrants from Nigeria Unemployment Among Ages 45 to 54 years Correlation Chart
The statistical analysis conducted on geographies consisting of 344,969,463 people shows no correlation between the proportion of Belgians and unemployment rate among population between the ages 45 and 54 in the United States with a correlation coefficient (R) of -0.031 and weighted average of 4.1%. Similarly, the statistical analysis conducted on geographies consisting of 279,785,103 people shows a substantial positive correlation between the proportion of Immigrants from Nigeria and unemployment rate among population between the ages 45 and 54 in the United States with a correlation coefficient (R) of 0.531 and weighted average of 4.6%, a difference of 11.4%.
Unemployment Among Ages 45 to 54 years Correlation Summary
| Measurement | Belgian | Immigrants from Nigeria |
| Minimum | 0.10% | 0.80% |
| Maximum | 20.0% | 20.0% |
| Range | 19.9% | 19.2% |
| Mean | 4.1% | 5.3% |
| Median | 3.8% | 4.6% |
| Interquartile 25% (IQ1) | 1.5% | 3.9% |
| Interquartile 75% (IQ3) | 4.9% | 5.4% |
| Interquartile Range (IQR) | 3.4% | 1.5% |
| Standard Deviation (Sample) | 4.4% | 3.3% |
| Standard Deviation (Population) | 4.4% | 3.3% |
Similar Demographics by Unemployment Among Ages 45 to 54 years
Demographics Similar to Belgians by Unemployment Among Ages 45 to 54 years
In terms of unemployment among ages 45 to 54 years, the demographic groups most similar to Belgians are British (4.1%, a difference of 0.010%), Bhutanese (4.2%, a difference of 0.030%), Welsh (4.1%, a difference of 0.13%), Slovene (4.2%, a difference of 0.14%), and Immigrants from South Central Asia (4.2%, a difference of 0.17%).
| Demographics | Rating | Rank | Unemployment Among Ages 45 to 54 years |
| Yugoslavians | 100.0 /100 | #22 | Exceptional 4.1% |
| Bulgarians | 100.0 /100 | #23 | Exceptional 4.1% |
| Carpatho Rusyns | 100.0 /100 | #24 | Exceptional 4.1% |
| Bolivians | 99.9 /100 | #25 | Exceptional 4.1% |
| Scottish | 99.9 /100 | #26 | Exceptional 4.1% |
| Immigrants | Moldova | 99.9 /100 | #27 | Exceptional 4.1% |
| Welsh | 99.9 /100 | #28 | Exceptional 4.1% |
| Belgians | 99.9 /100 | #29 | Exceptional 4.1% |
| British | 99.9 /100 | #30 | Exceptional 4.1% |
| Bhutanese | 99.9 /100 | #31 | Exceptional 4.2% |
| Slovenes | 99.9 /100 | #32 | Exceptional 4.2% |
| Immigrants | South Central Asia | 99.9 /100 | #33 | Exceptional 4.2% |
| Dutch | 99.9 /100 | #34 | Exceptional 4.2% |
| Immigrants | Taiwan | 99.8 /100 | #35 | Exceptional 4.2% |
| Croatians | 99.8 /100 | #36 | Exceptional 4.2% |
Demographics Similar to Immigrants from Nigeria by Unemployment Among Ages 45 to 54 years
In terms of unemployment among ages 45 to 54 years, the demographic groups most similar to Immigrants from Nigeria are Immigrants from Africa (4.6%, a difference of 0.030%), Arab (4.6%, a difference of 0.050%), Immigrants from Switzerland (4.6%, a difference of 0.070%), Immigrants from South America (4.6%, a difference of 0.11%), and Creek (4.6%, a difference of 0.14%).
| Demographics | Rating | Rank | Unemployment Among Ages 45 to 54 years |
| Immigrants | Peru | 19.1 /100 | #202 | Poor 4.6% |
| Liberians | 18.7 /100 | #203 | Poor 4.6% |
| Immigrants | Morocco | 16.8 /100 | #204 | Poor 4.6% |
| Immigrants | Greece | 16.2 /100 | #205 | Poor 4.6% |
| Immigrants | Switzerland | 14.0 /100 | #206 | Poor 4.6% |
| Arabs | 13.7 /100 | #207 | Poor 4.6% |
| Immigrants | Africa | 13.6 /100 | #208 | Poor 4.6% |
| Immigrants | Nigeria | 13.3 /100 | #209 | Poor 4.6% |
| Immigrants | South America | 12.2 /100 | #210 | Poor 4.6% |
| Creek | 11.9 /100 | #211 | Poor 4.6% |
| Immigrants | Iran | 11.5 /100 | #212 | Poor 4.6% |
| Panamanians | 10.7 /100 | #213 | Poor 4.6% |
| Cherokee | 10.6 /100 | #214 | Poor 4.6% |
| Immigrants | Panama | 10.4 /100 | #215 | Poor 4.6% |
| Lumbee | 9.2 /100 | #216 | Tragic 4.6% |