Belgian vs Immigrants from Burma/Myanmar Unemployment Among Ages 25 to 29 years
COMPARE
Belgian
Immigrants from Burma/Myanmar
Unemployment Among Ages 25 to 29 years
Unemployment Among Ages 25 to 29 years Comparison
Belgians
Immigrants from Burma/Myanmar
6.3%
UNEMPLOYMENT AMONG AGES 25 TO 29 YEARS
97.0/ 100
METRIC RATING
73rd/ 347
METRIC RANK
6.2%
UNEMPLOYMENT AMONG AGES 25 TO 29 YEARS
98.7/ 100
METRIC RATING
56th/ 347
METRIC RANK
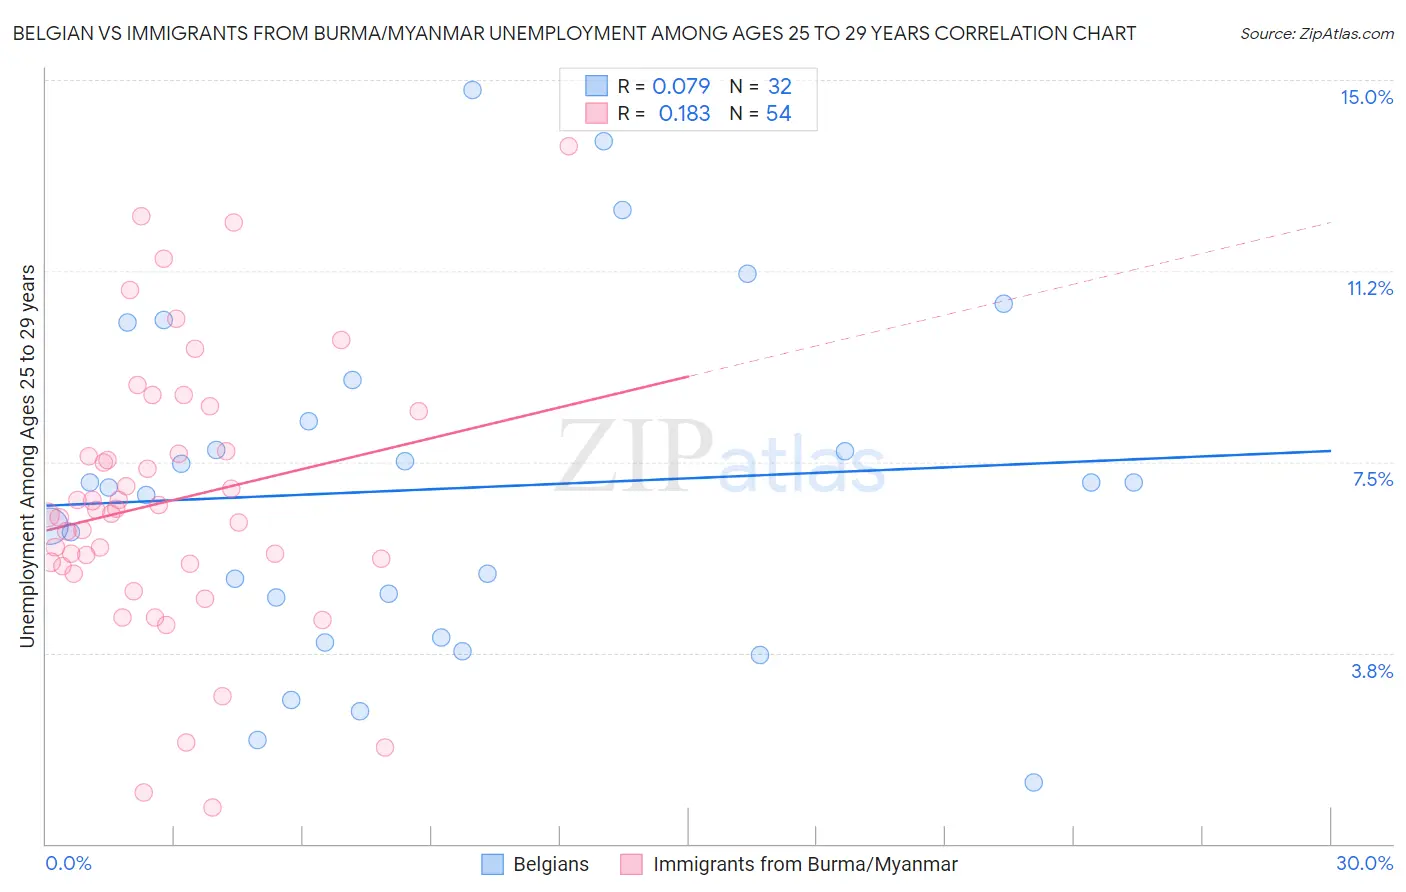
Belgian vs Immigrants from Burma/Myanmar Unemployment Among Ages 25 to 29 years Correlation Chart
The statistical analysis conducted on geographies consisting of 334,915,695 people shows a slight positive correlation between the proportion of Belgians and unemployment rate among population between the ages 25 and 29 in the United States with a correlation coefficient (R) of 0.079 and weighted average of 6.3%. Similarly, the statistical analysis conducted on geographies consisting of 169,671,818 people shows a poor positive correlation between the proportion of Immigrants from Burma/Myanmar and unemployment rate among population between the ages 25 and 29 in the United States with a correlation coefficient (R) of 0.183 and weighted average of 6.2%, a difference of 1.4%.
Unemployment Among Ages 25 to 29 years Correlation Summary
| Measurement | Belgian | Immigrants from Burma/Myanmar |
| Minimum | 1.2% | 0.70% |
| Maximum | 14.8% | 13.7% |
| Range | 13.6% | 13.0% |
| Mean | 7.0% | 6.7% |
| Median | 7.0% | 6.5% |
| Interquartile 25% (IQ1) | 4.4% | 5.5% |
| Interquartile 75% (IQ3) | 8.7% | 7.7% |
| Interquartile Range (IQR) | 4.3% | 2.2% |
| Standard Deviation (Sample) | 3.3% | 2.7% |
| Standard Deviation (Population) | 3.3% | 2.6% |
Demographics Similar to Belgians and Immigrants from Burma/Myanmar by Unemployment Among Ages 25 to 29 years
In terms of unemployment among ages 25 to 29 years, the demographic groups most similar to Belgians are Carpatho Rusyn (6.3%, a difference of 0.020%), Scandinavian (6.3%, a difference of 0.25%), Immigrants from France (6.3%, a difference of 0.27%), Immigrants from Malaysia (6.3%, a difference of 0.31%), and Immigrants from Hong Kong (6.3%, a difference of 0.32%). Similarly, the demographic groups most similar to Immigrants from Burma/Myanmar are Immigrants from Netherlands (6.2%, a difference of 0.020%), Immigrants from Saudi Arabia (6.2%, a difference of 0.090%), Swedish (6.2%, a difference of 0.20%), Immigrants from Eastern Asia (6.2%, a difference of 0.25%), and Luxembourger (6.2%, a difference of 0.38%).
| Demographics | Rating | Rank | Unemployment Among Ages 25 to 29 years |
| Swedes | 98.8 /100 | #54 | Exceptional 6.2% |
| Immigrants | Netherlands | 98.7 /100 | #55 | Exceptional 6.2% |
| Immigrants | Burma/Myanmar | 98.7 /100 | #56 | Exceptional 6.2% |
| Immigrants | Saudi Arabia | 98.6 /100 | #57 | Exceptional 6.2% |
| Immigrants | Eastern Asia | 98.4 /100 | #58 | Exceptional 6.2% |
| Luxembourgers | 98.3 /100 | #59 | Exceptional 6.2% |
| Immigrants | Taiwan | 98.3 /100 | #60 | Exceptional 6.2% |
| Bhutanese | 98.2 /100 | #61 | Exceptional 6.2% |
| Immigrants | China | 98.1 /100 | #62 | Exceptional 6.2% |
| Kenyans | 98.0 /100 | #63 | Exceptional 6.3% |
| Immigrants | Sri Lanka | 97.9 /100 | #64 | Exceptional 6.3% |
| Immigrants | Lebanon | 97.8 /100 | #65 | Exceptional 6.3% |
| Indians (Asian) | 97.8 /100 | #66 | Exceptional 6.3% |
| Immigrants | Northern Africa | 97.8 /100 | #67 | Exceptional 6.3% |
| Palestinians | 97.7 /100 | #68 | Exceptional 6.3% |
| Immigrants | Hong Kong | 97.5 /100 | #69 | Exceptional 6.3% |
| Immigrants | Malaysia | 97.5 /100 | #70 | Exceptional 6.3% |
| Immigrants | France | 97.4 /100 | #71 | Exceptional 6.3% |
| Scandinavians | 97.4 /100 | #72 | Exceptional 6.3% |
| Belgians | 97.0 /100 | #73 | Exceptional 6.3% |
| Carpatho Rusyns | 96.9 /100 | #74 | Exceptional 6.3% |