Belgian vs Burmese Unemployment Among Women with Children Under 6 years

COMPARE

Belgian
Race
Ancestry
AfghanAfricanAlaska NativeAlaskan AthabascanAlbanianAleutAlsatianAmericanApacheArabArapahoArgentineanArmenianAssyrian/Chaldean/SyriacAustralianAustrianBahamianBangladeshiBarbadianBasqueBelgianBelizeanBermudanBhutaneseBlackfeetBolivianBrazilianBritishBritish West IndianBulgarianCajunCambodianCanadianCape VerdeanCarpatho RusynCelticCentral AmericanCentral American IndianCherokeeCheyenneChickasawChileanChineseChippewaChoctawColombianColvilleComancheCosta RicanCreeCreekCroatianCrowCubanCypriotCzechCzechoslovakianDanishDelawareDominicanDutchDutch West IndianEastern EuropeanEcuadorianEgyptianEnglishEstonianEthiopianEuropeanFijianFilipinoFinnishFrenchFrench American IndianFrench CanadianGermanGerman RussianGhanaianGreekGuamanian/ChamorroGuatemalanGuyaneseHaitianHmongHonduranHopiHoumaHungarianIcelanderIndian (Asian)IndonesianInupiatIranianIraqiIrishIroquoisIsraeliItalianJamaicanJapaneseJordanianKenyanKiowaKoreanLaotianLatvianLebaneseLiberianLithuanianLumbeeLuxembourgerMacedonianMalaysianMalteseMarshalleseMenomineeMexicanMexican American IndianMongolianMoroccanNative HawaiianNavajoNepaleseNew ZealanderNicaraguanNigerianNorthern EuropeanNorwegianOkinawanOsageOttawaPaiutePakistaniPalestinianPanamanianParaguayanPennsylvania GermanPeruvianPimaPolishPortuguesePotawatomiPuebloPuerto RicanPuget Sound SalishRomanianRussianSalvadoranSamoanScandinavianScotch-IrishScottishSeminoleSenegaleseSerbianShoshoneSierra LeoneanSiouxSlavicSlovakSloveneSomaliSouth AfricanSouth AmericanSouth American IndianSoviet UnionSpaniardSpanishSpanish AmericanSpanish American IndianSri LankanSubsaharan AfricanSudaneseSwedishSwissSyrianTaiwaneseThaiTlingit-HaidaTohono O'OdhamTonganTrinidadian and TobagonianTsimshianTurkishU.S. Virgin IslanderUgandanUkrainianUruguayanUteVenezuelanVietnameseWelshWest IndianYakamaYaquiYugoslavianYumanYup'ikZimbabwean
Immigration
NonimmigrantsImmigrantsAfghanistanAfricaAlbaniaArgentinaArmeniaAsiaAustraliaAustriaBahamasBangladeshBarbadosBelarusBelgiumBelizeBoliviaBosnia and HerzegovinaBrazilBulgariaBurma/MyanmarCabo VerdeCambodiaCameroonCanadaCaribbeanCentral AmericaChileChinaColombiaCongoCosta RicaCroatiaCubaCzechoslovakiaDenmarkDominicaDominican RepublicEastern AfricaEastern AsiaEastern EuropeEcuadorEgyptEl SalvadorEnglandEritreaEthiopiaEuropeFijiFranceGermanyGhanaGreeceGrenadaGuatemalaGuyanaHaitiHondurasHong KongHungaryIndiaIndonesiaIranIraqIrelandIsraelItalyJamaicaJapanJordanKazakhstanKenyaKoreaKuwaitLaosLatin AmericaLatviaLebanonLiberiaLithuaniaMalaysiaMexicoMicronesiaMiddle AfricaMoldovaMoroccoNepalNetherlandsNicaraguaNigeriaNorth AmericaNorth MacedoniaNorthern AfricaNorthern EuropeNorwayOceaniaPakistanPanamaPeruPhilippinesPolandPortugalRomaniaRussiaSaudi ArabiaScotlandSenegalSerbiaSierra LeoneSingaporeSomaliaSouth AfricaSouth AmericaSouth Central AsiaSouth Eastern AsiaSouthern EuropeSpainSri LankaSt. Vincent and the GrenadinesSudanSwedenSwitzerlandSyriaTaiwanThailandTrinidad and TobagoTurkeyUgandaUkraineUruguayUzbekistanVenezuelaVietnamWest IndiesWestern AfricaWestern AsiaWestern EuropeYemenZaireZimbabweAzores
Burmese
Race
Ancestry
AfghanAfricanAlaska NativeAlaskan AthabascanAlbanianAleutAlsatianAmericanApacheArabArapahoArgentineanArmenianAssyrian/Chaldean/SyriacAustralianAustrianBahamianBangladeshiBarbadianBasqueBelizeanBermudanBhutaneseBlackfeetBolivianBrazilianBritishBritish West IndianBulgarianBurmeseCajunCambodianCanadianCape VerdeanCarpatho RusynCelticCentral AmericanCentral American IndianCherokeeCheyenneChickasawChileanChineseChippewaChoctawColombianColvilleComancheCosta RicanCreeCreekCroatianCrowCubanCypriotCzechCzechoslovakianDanishDelawareDominicanDutchDutch West IndianEastern EuropeanEcuadorianEgyptianEnglishEstonianEthiopianEuropeanFijianFilipinoFinnishFrenchFrench American IndianFrench CanadianGermanGerman RussianGhanaianGreekGuamanian/ChamorroGuatemalanGuyaneseHaitianHmongHonduranHopiHoumaHungarianIcelanderIndian (Asian)IndonesianInupiatIranianIraqiIrishIroquoisIsraeliItalianJamaicanJapaneseJordanianKenyanKiowaKoreanLaotianLatvianLebaneseLiberianLithuanianLumbeeLuxembourgerMacedonianMalaysianMalteseMarshalleseMenomineeMexicanMexican American IndianMongolianMoroccanNative HawaiianNavajoNepaleseNew ZealanderNicaraguanNigerianNorthern EuropeanNorwegianOkinawanOsageOttawaPaiutePakistaniPalestinianPanamanianParaguayanPennsylvania GermanPeruvianPimaPolishPortuguesePotawatomiPuebloPuerto RicanPuget Sound SalishRomanianRussianSalvadoranSamoanScandinavianScotch-IrishScottishSeminoleSenegaleseSerbianShoshoneSierra LeoneanSiouxSlavicSlovakSloveneSomaliSouth AfricanSouth AmericanSouth American IndianSoviet UnionSpaniardSpanishSpanish AmericanSpanish American IndianSri LankanSubsaharan AfricanSudaneseSwedishSwissSyrianTaiwaneseThaiTlingit-HaidaTohono O'OdhamTonganTrinidadian and TobagonianTsimshianTurkishU.S. Virgin IslanderUgandanUkrainianUruguayanUteVenezuelanVietnameseWelshWest IndianYakamaYaquiYugoslavianYumanYup'ikZimbabwean
Immigration
NonimmigrantsImmigrantsAfghanistanAfricaAlbaniaArgentinaArmeniaAsiaAustraliaAustriaBahamasBangladeshBarbadosBelarusBelgiumBelizeBoliviaBosnia and HerzegovinaBrazilBulgariaBurma/MyanmarCabo VerdeCambodiaCameroonCanadaCaribbeanCentral AmericaChileChinaColombiaCongoCosta RicaCroatiaCubaCzechoslovakiaDenmarkDominicaDominican RepublicEastern AfricaEastern AsiaEastern EuropeEcuadorEgyptEl SalvadorEnglandEritreaEthiopiaEuropeFijiFranceGermanyGhanaGreeceGrenadaGuatemalaGuyanaHaitiHondurasHong KongHungaryIndiaIndonesiaIranIraqIrelandIsraelItalyJamaicaJapanJordanKazakhstanKenyaKoreaKuwaitLaosLatin AmericaLatviaLebanonLiberiaLithuaniaMalaysiaMexicoMicronesiaMiddle AfricaMoldovaMoroccoNepalNetherlandsNicaraguaNigeriaNorth AmericaNorth MacedoniaNorthern AfricaNorthern EuropeNorwayOceaniaPakistanPanamaPeruPhilippinesPolandPortugalRomaniaRussiaSaudi ArabiaScotlandSenegalSerbiaSierra LeoneSingaporeSomaliaSouth AfricaSouth AmericaSouth Central AsiaSouth Eastern AsiaSouthern EuropeSpainSri LankaSt. Vincent and the GrenadinesSudanSwedenSwitzerlandSyriaTaiwanThailandTrinidad and TobagoTurkeyUgandaUkraineUruguayUzbekistanVenezuelaVietnamWest IndiesWestern AfricaWestern AsiaWestern EuropeYemenZaireZimbabweAzores
Unemployment Among Women with Children Under 6 years
Income
Poverty
Unemployment
Labor Participation
Family Structure
Vehicle Availability
Education Level
Disability

Unemployment Among Women with Children Under 6 years Comparison

Belgians

Burmese

Good
Exceptional
7.6%
UNEMPLOYMENT AMONG WOMEN WITH CHILDREN UNDER 6 YEARS
63.5/ 100
METRIC RATING
166th/ 347
METRIC RANK
6.5%
UNEMPLOYMENT AMONG WOMEN WITH CHILDREN UNDER 6 YEARS
100.0/ 100
METRIC RATING
21st/ 347
METRIC RANK

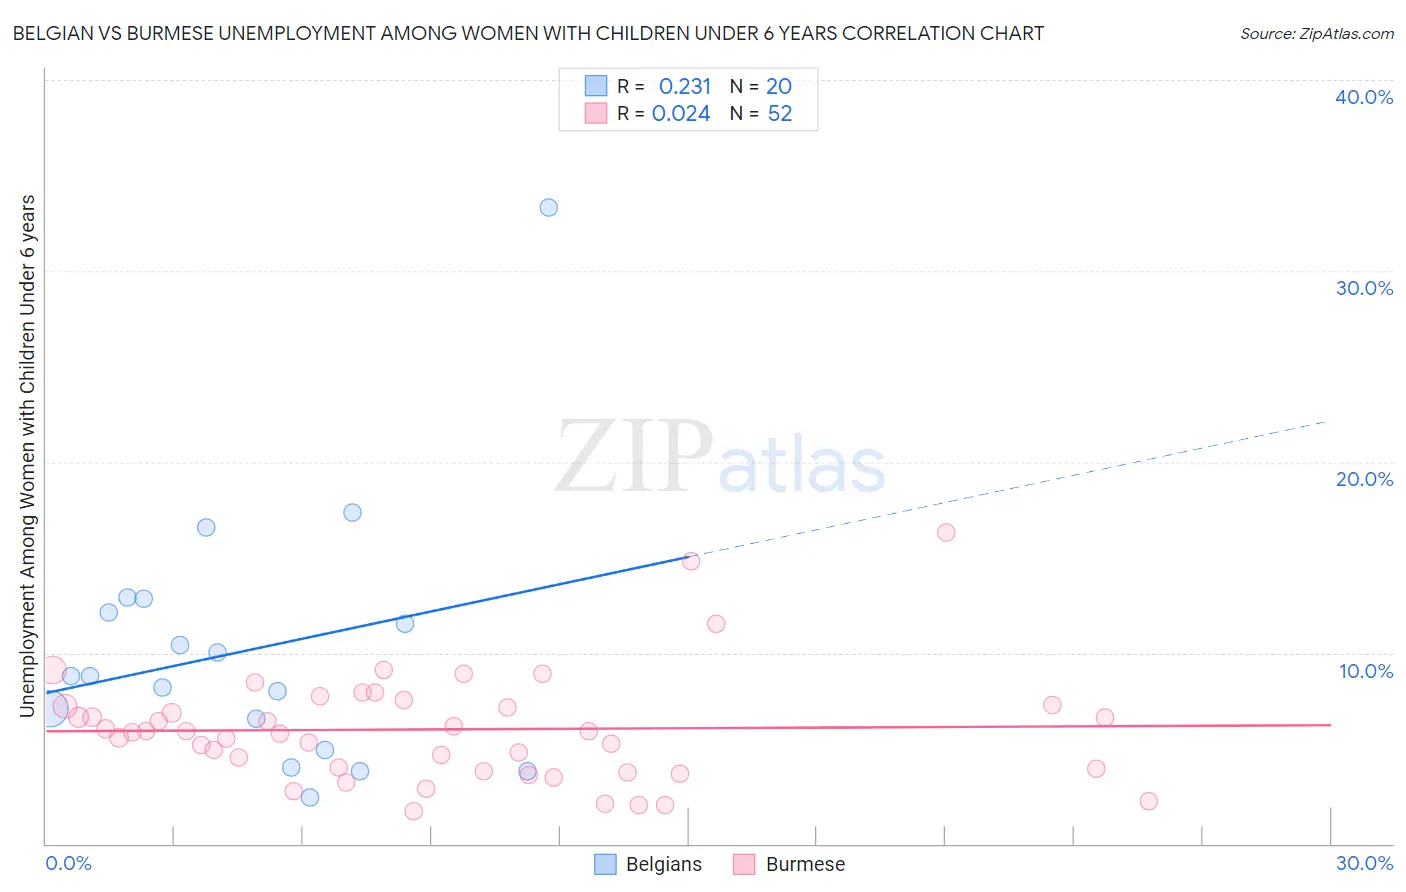
Belgian vs Burmese Unemployment Among Women with Children Under 6 years Correlation Chart

The statistical analysis conducted on geographies consisting of 265,159,177 people shows a weak positive correlation between the proportion of Belgians and unemployment rate among women with children under the age of 6 in the United States with a correlation coefficient (R) of 0.231 and weighted average of 7.6%. Similarly, the statistical analysis conducted on geographies consisting of 339,459,129 people shows no correlation between the proportion of Burmese and unemployment rate among women with children under the age of 6 in the United States with a correlation coefficient (R) of 0.024 and weighted average of 6.5%, a difference of 16.9%.
Belgian vs Burmese Unemployment Among Women with Children Under 6 years

Unemployment Among Women with Children Under 6 years Correlation Summary

MeasurementBelgianBurmese
Minimum2.4%1.7%
Maximum33.3%16.3%
Range30.9%14.6%
Mean10.2%6.0%
Median8.8%5.9%
Interquartile 25% (IQ1)5.7%3.8%
Interquartile 75% (IQ3)12.5%7.2%
Interquartile Range (IQR)6.7%3.4%
Standard Deviation (Sample)6.8%2.9%
Standard Deviation (Population)6.7%2.9%

Similar Demographics by Unemployment Among Women with Children Under 6 years

Demographics Similar to Belgians by Unemployment Among Women with Children Under 6 years

In terms of unemployment among women with children under 6 years, the demographic groups most similar to Belgians are Kenyan (7.6%, a difference of 0.070%), Immigrants from Canada (7.6%, a difference of 0.14%), Immigrants from South America (7.6%, a difference of 0.15%), Immigrants from Scotland (7.6%, a difference of 0.15%), and Ugandan (7.6%, a difference of 0.17%).
DemographicsRating | RankUnemployment Among Women with Children Under 6 years
Immigrants | Philippines
71.3
/100
|
#159
Good
7.5%
Bolivians
70.8
/100
|
#160
Good
7.5%
Immigrants | Western Asia
70.2
/100
|
#161
Good
7.5%
Immigrants | Lithuania
68.8
/100
|
#162
Good
7.5%
British
66.3
/100
|
#163
Good
7.6%
Ugandans
65.8
/100
|
#164
Good
7.6%
Immigrants | South America
65.6
/100
|
#165
Good
7.6%
Belgians
63.5
/100
|
#166
Good
7.6%
Kenyans
62.5
/100
|
#167
Good
7.6%
Immigrants | Canada
61.6
/100
|
#168
Good
7.6%
Immigrants | Scotland
61.3
/100
|
#169
Good
7.6%
Czechs
59.8
/100
|
#170
Average
7.6%
Immigrants | Grenada
59.0
/100
|
#171
Average
7.6%
Immigrants | North America
57.7
/100
|
#172
Average
7.6%
Cree
51.6
/100
|
#173
Average
7.6%

Demographics Similar to Burmese by Unemployment Among Women with Children Under 6 years

In terms of unemployment among women with children under 6 years, the demographic groups most similar to Burmese are Ute (6.5%, a difference of 0.050%), Mongolian (6.5%, a difference of 0.10%), Immigrants from Korea (6.5%, a difference of 0.42%), Assyrian/Chaldean/Syriac (6.5%, a difference of 0.43%), and Bulgarian (6.5%, a difference of 0.62%).
DemographicsRating | RankUnemployment Among Women with Children Under 6 years
Immigrants | Bulgaria
100.0
/100
|
#14
Exceptional
6.3%
Thais
100.0
/100
|
#15
Exceptional
6.3%
Immigrants | Uzbekistan
100.0
/100
|
#16
Exceptional
6.3%
Immigrants | Malaysia
100.0
/100
|
#17
Exceptional
6.4%
Assyrians/Chaldeans/Syriacs
100.0
/100
|
#18
Exceptional
6.5%
Mongolians
100.0
/100
|
#19
Exceptional
6.5%
Ute
100.0
/100
|
#20
Exceptional
6.5%
Burmese
100.0
/100
|
#21
Exceptional
6.5%
Immigrants | Korea
100.0
/100
|
#22
Exceptional
6.5%
Bulgarians
100.0
/100
|
#23
Exceptional
6.5%
Laotians
100.0
/100
|
#24
Exceptional
6.5%
Soviet Union
100.0
/100
|
#25
Exceptional
6.5%
Cypriots
100.0
/100
|
#26
Exceptional
6.5%
Immigrants | Japan
100.0
/100
|
#27
Exceptional
6.5%
Immigrants | Israel
100.0
/100
|
#28
Exceptional
6.5%