Basque vs Immigrants from Argentina Unemployment Among Women with Children Under 6 years
COMPARE
Basque
Immigrants from Argentina
Unemployment Among Women with Children Under 6 years
Unemployment Among Women with Children Under 6 years Comparison
Basques
Immigrants from Argentina
7.8%
UNEMPLOYMENT AMONG WOMEN WITH CHILDREN UNDER 6 YEARS
24.7/ 100
METRIC RATING
201st/ 347
METRIC RANK
7.5%
UNEMPLOYMENT AMONG WOMEN WITH CHILDREN UNDER 6 YEARS
81.5/ 100
METRIC RATING
142nd/ 347
METRIC RANK
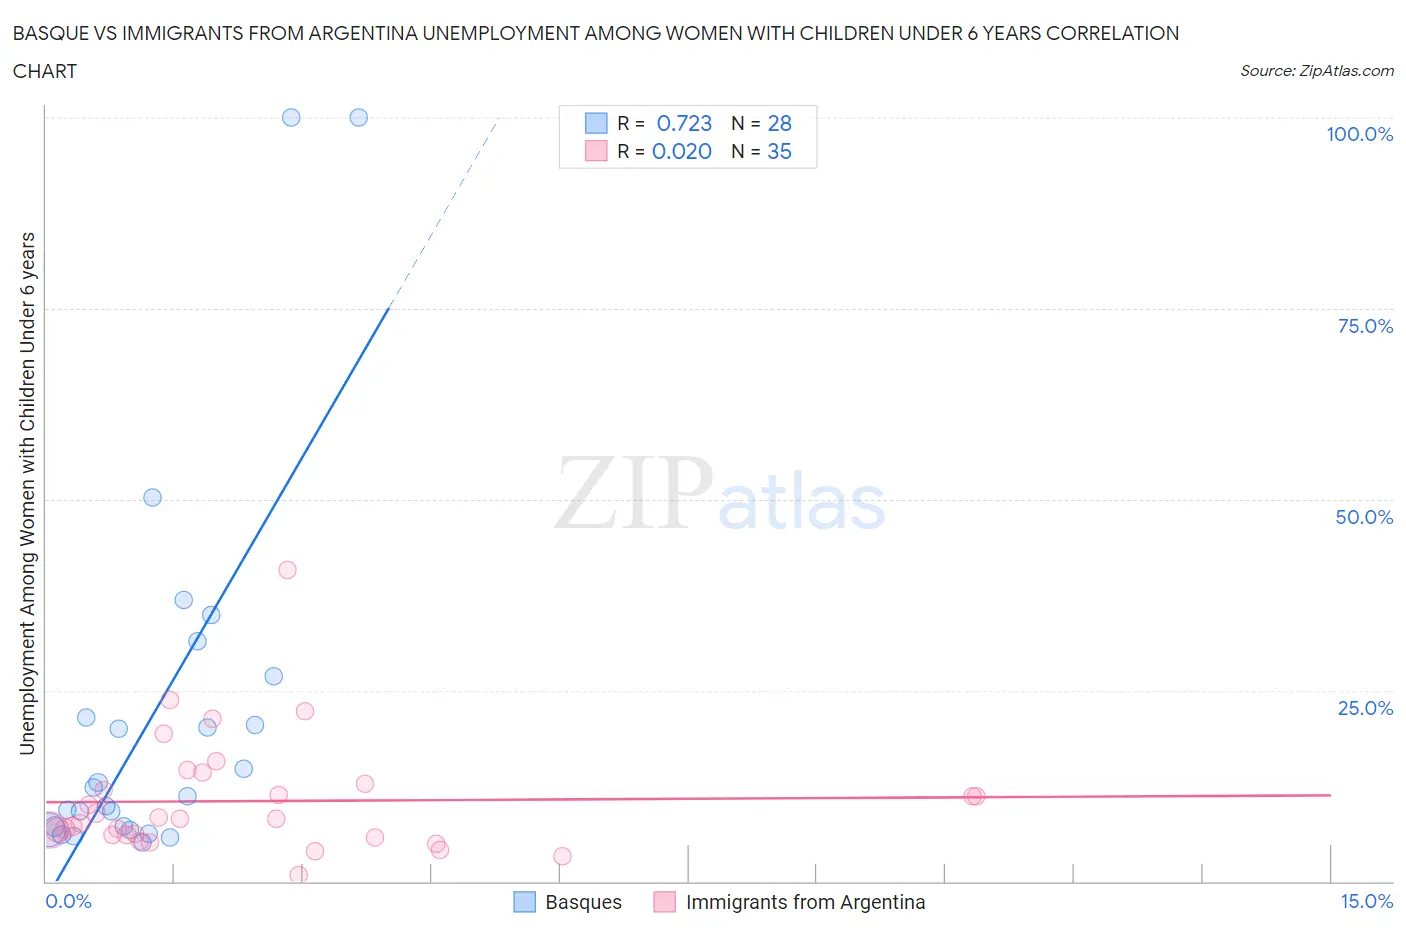
Basque vs Immigrants from Argentina Unemployment Among Women with Children Under 6 years Correlation Chart
The statistical analysis conducted on geographies consisting of 142,270,112 people shows a strong positive correlation between the proportion of Basques and unemployment rate among women with children under the age of 6 in the United States with a correlation coefficient (R) of 0.723 and weighted average of 7.8%. Similarly, the statistical analysis conducted on geographies consisting of 215,800,646 people shows no correlation between the proportion of Immigrants from Argentina and unemployment rate among women with children under the age of 6 in the United States with a correlation coefficient (R) of 0.020 and weighted average of 7.5%, a difference of 4.4%.
Unemployment Among Women with Children Under 6 years Correlation Summary
| Measurement | Basque | Immigrants from Argentina |
| Minimum | 5.1% | 0.80% |
| Maximum | 100.0% | 40.8% |
| Range | 94.9% | 40.0% |
| Mean | 21.7% | 10.5% |
| Median | 11.7% | 8.2% |
| Interquartile 25% (IQ1) | 6.9% | 6.0% |
| Interquartile 75% (IQ3) | 24.2% | 12.8% |
| Interquartile Range (IQR) | 17.2% | 6.7% |
| Standard Deviation (Sample) | 24.9% | 7.6% |
| Standard Deviation (Population) | 24.4% | 7.5% |
Similar Demographics by Unemployment Among Women with Children Under 6 years
Demographics Similar to Basques by Unemployment Among Women with Children Under 6 years
In terms of unemployment among women with children under 6 years, the demographic groups most similar to Basques are Guamanian/Chamorro (7.8%, a difference of 0.070%), Sudanese (7.8%, a difference of 0.11%), Spaniard (7.8%, a difference of 0.12%), Immigrants from Poland (7.8%, a difference of 0.22%), and Lebanese (7.8%, a difference of 0.23%).
| Demographics | Rating | Rank | Unemployment Among Women with Children Under 6 years |
| Syrians | 31.9 /100 | #194 | Fair 7.7% |
| Malaysians | 31.1 /100 | #195 | Fair 7.7% |
| Immigrants | St. Vincent and the Grenadines | 31.1 /100 | #196 | Fair 7.7% |
| Italians | 30.4 /100 | #197 | Fair 7.7% |
| Lithuanians | 30.0 /100 | #198 | Fair 7.8% |
| Immigrants | Poland | 27.3 /100 | #199 | Fair 7.8% |
| Guamanians/Chamorros | 25.5 /100 | #200 | Fair 7.8% |
| Basques | 24.7 /100 | #201 | Fair 7.8% |
| Sudanese | 23.5 /100 | #202 | Fair 7.8% |
| Spaniards | 23.3 /100 | #203 | Fair 7.8% |
| Lebanese | 22.2 /100 | #204 | Fair 7.8% |
| Immigrants | Immigrants | 21.4 /100 | #205 | Fair 7.8% |
| Hungarians | 21.2 /100 | #206 | Fair 7.8% |
| Canadians | 20.6 /100 | #207 | Fair 7.8% |
| Immigrants | Syria | 18.9 /100 | #208 | Poor 7.8% |
Demographics Similar to Immigrants from Argentina by Unemployment Among Women with Children Under 6 years
In terms of unemployment among women with children under 6 years, the demographic groups most similar to Immigrants from Argentina are Korean (7.5%, a difference of 0.020%), Greek (7.4%, a difference of 0.12%), Scandinavian (7.4%, a difference of 0.18%), European (7.5%, a difference of 0.25%), and Immigrants from Jordan (7.5%, a difference of 0.28%).
| Demographics | Rating | Rank | Unemployment Among Women with Children Under 6 years |
| Immigrants | Northern Africa | 85.3 /100 | #135 | Excellent 7.4% |
| Immigrants | Morocco | 84.9 /100 | #136 | Excellent 7.4% |
| Immigrants | Cambodia | 84.6 /100 | #137 | Excellent 7.4% |
| Immigrants | Norway | 84.1 /100 | #138 | Excellent 7.4% |
| Immigrants | Colombia | 83.9 /100 | #139 | Excellent 7.4% |
| Scandinavians | 83.0 /100 | #140 | Excellent 7.4% |
| Greeks | 82.6 /100 | #141 | Excellent 7.4% |
| Immigrants | Argentina | 81.5 /100 | #142 | Excellent 7.5% |
| Koreans | 81.3 /100 | #143 | Excellent 7.5% |
| Europeans | 79.1 /100 | #144 | Good 7.5% |
| Immigrants | Jordan | 78.9 /100 | #145 | Good 7.5% |
| Japanese | 78.9 /100 | #146 | Good 7.5% |
| Immigrants | Oceania | 78.4 /100 | #147 | Good 7.5% |
| Immigrants | Brazil | 77.3 /100 | #148 | Good 7.5% |
| Colombians | 76.1 /100 | #149 | Good 7.5% |