Barbadian vs Immigrants from Saudi Arabia Unemployment Among Women with Children Under 6 years
COMPARE
Barbadian
Immigrants from Saudi Arabia
Unemployment Among Women with Children Under 6 years
Unemployment Among Women with Children Under 6 years Comparison
Barbadians
Immigrants from Saudi Arabia
8.3%
UNEMPLOYMENT AMONG WOMEN WITH CHILDREN UNDER 6 YEARS
0.4/ 100
METRIC RATING
259th/ 347
METRIC RANK
7.2%
UNEMPLOYMENT AMONG WOMEN WITH CHILDREN UNDER 6 YEARS
97.3/ 100
METRIC RATING
103rd/ 347
METRIC RANK
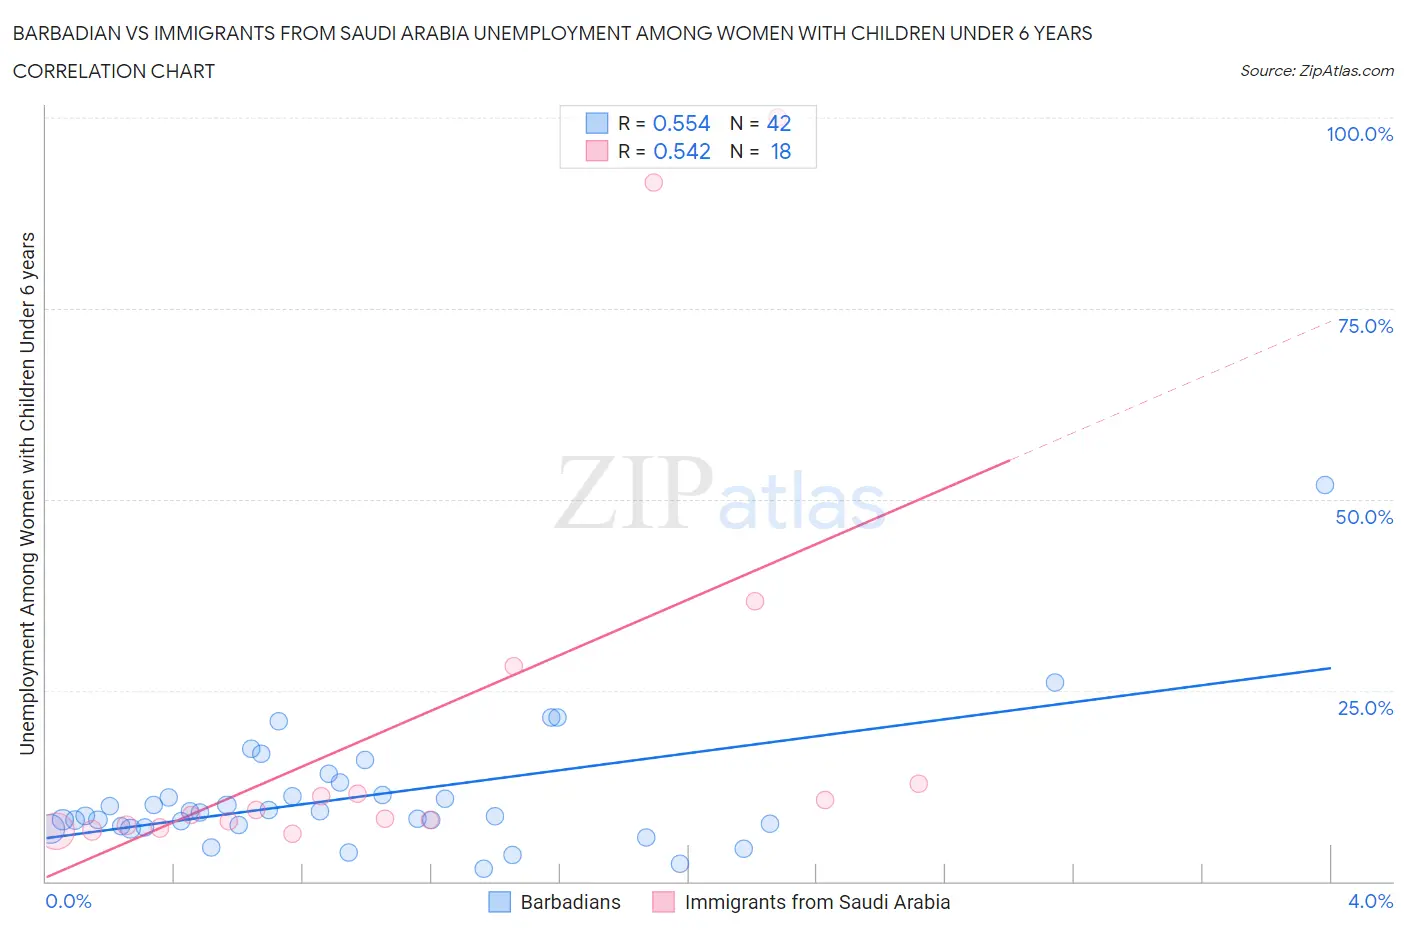
Barbadian vs Immigrants from Saudi Arabia Unemployment Among Women with Children Under 6 years Correlation Chart
The statistical analysis conducted on geographies consisting of 125,746,302 people shows a substantial positive correlation between the proportion of Barbadians and unemployment rate among women with children under the age of 6 in the United States with a correlation coefficient (R) of 0.554 and weighted average of 8.3%. Similarly, the statistical analysis conducted on geographies consisting of 143,989,640 people shows a substantial positive correlation between the proportion of Immigrants from Saudi Arabia and unemployment rate among women with children under the age of 6 in the United States with a correlation coefficient (R) of 0.542 and weighted average of 7.2%, a difference of 16.0%.
Unemployment Among Women with Children Under 6 years Correlation Summary
| Measurement | Barbadian | Immigrants from Saudi Arabia |
| Minimum | 1.6% | 6.3% |
| Maximum | 51.9% | 100.0% |
| Range | 50.3% | 93.7% |
| Mean | 11.0% | 21.0% |
| Median | 8.8% | 9.0% |
| Interquartile 25% (IQ1) | 7.3% | 7.3% |
| Interquartile 75% (IQ3) | 11.3% | 12.8% |
| Interquartile Range (IQR) | 4.0% | 5.5% |
| Standard Deviation (Sample) | 8.4% | 28.4% |
| Standard Deviation (Population) | 8.3% | 27.6% |
Similar Demographics by Unemployment Among Women with Children Under 6 years
Demographics Similar to Barbadians by Unemployment Among Women with Children Under 6 years
In terms of unemployment among women with children under 6 years, the demographic groups most similar to Barbadians are White/Caucasian (8.4%, a difference of 0.26%), Immigrants from Ghana (8.3%, a difference of 0.29%), British West Indian (8.3%, a difference of 0.31%), Immigrants from Liberia (8.4%, a difference of 0.54%), and West Indian (8.4%, a difference of 0.55%).
| Demographics | Rating | Rank | Unemployment Among Women with Children Under 6 years |
| Ghanaians | 1.0 /100 | #252 | Tragic 8.2% |
| Immigrants | Guyana | 0.8 /100 | #253 | Tragic 8.2% |
| Immigrants | Caribbean | 0.7 /100 | #254 | Tragic 8.3% |
| Immigrants | Portugal | 0.6 /100 | #255 | Tragic 8.3% |
| Celtics | 0.6 /100 | #256 | Tragic 8.3% |
| British West Indians | 0.5 /100 | #257 | Tragic 8.3% |
| Immigrants | Ghana | 0.5 /100 | #258 | Tragic 8.3% |
| Barbadians | 0.4 /100 | #259 | Tragic 8.3% |
| Whites/Caucasians | 0.3 /100 | #260 | Tragic 8.4% |
| Immigrants | Liberia | 0.3 /100 | #261 | Tragic 8.4% |
| West Indians | 0.3 /100 | #262 | Tragic 8.4% |
| Scotch-Irish | 0.3 /100 | #263 | Tragic 8.4% |
| Hondurans | 0.3 /100 | #264 | Tragic 8.4% |
| French Canadians | 0.3 /100 | #265 | Tragic 8.4% |
| Immigrants | Honduras | 0.3 /100 | #266 | Tragic 8.4% |
Demographics Similar to Immigrants from Saudi Arabia by Unemployment Among Women with Children Under 6 years
In terms of unemployment among women with children under 6 years, the demographic groups most similar to Immigrants from Saudi Arabia are Immigrants from Nicaragua (7.2%, a difference of 0.0%), Chilean (7.2%, a difference of 0.030%), Immigrants from Northern Europe (7.2%, a difference of 0.050%), Immigrants from Egypt (7.2%, a difference of 0.080%), and Venezuelan (7.2%, a difference of 0.090%).
| Demographics | Rating | Rank | Unemployment Among Women with Children Under 6 years |
| Immigrants | Eastern Africa | 97.7 /100 | #96 | Exceptional 7.2% |
| Immigrants | South Eastern Asia | 97.6 /100 | #97 | Exceptional 7.2% |
| Russians | 97.5 /100 | #98 | Exceptional 7.2% |
| Immigrants | Europe | 97.5 /100 | #99 | Exceptional 7.2% |
| Immigrants | Northern Europe | 97.4 /100 | #100 | Exceptional 7.2% |
| Chileans | 97.4 /100 | #101 | Exceptional 7.2% |
| Immigrants | Nicaragua | 97.3 /100 | #102 | Exceptional 7.2% |
| Immigrants | Saudi Arabia | 97.3 /100 | #103 | Exceptional 7.2% |
| Immigrants | Egypt | 97.2 /100 | #104 | Exceptional 7.2% |
| Venezuelans | 97.2 /100 | #105 | Exceptional 7.2% |
| Immigrants | Pakistan | 97.2 /100 | #106 | Exceptional 7.2% |
| Immigrants | Kazakhstan | 97.1 /100 | #107 | Exceptional 7.2% |
| Eastern Europeans | 96.9 /100 | #108 | Exceptional 7.2% |
| Australians | 96.9 /100 | #109 | Exceptional 7.2% |
| Palestinians | 96.8 /100 | #110 | Exceptional 7.2% |