Barbadian vs Immigrants from Portugal Female Unemployment
COMPARE
Barbadian
Immigrants from Portugal
Female Unemployment
Female Unemployment Comparison
Barbadians
Immigrants from Portugal
6.2%
FEMALE UNEMPLOYMENT
0.0/ 100
METRIC RATING
303rd/ 347
METRIC RANK
5.8%
FEMALE UNEMPLOYMENT
0.2/ 100
METRIC RATING
258th/ 347
METRIC RANK
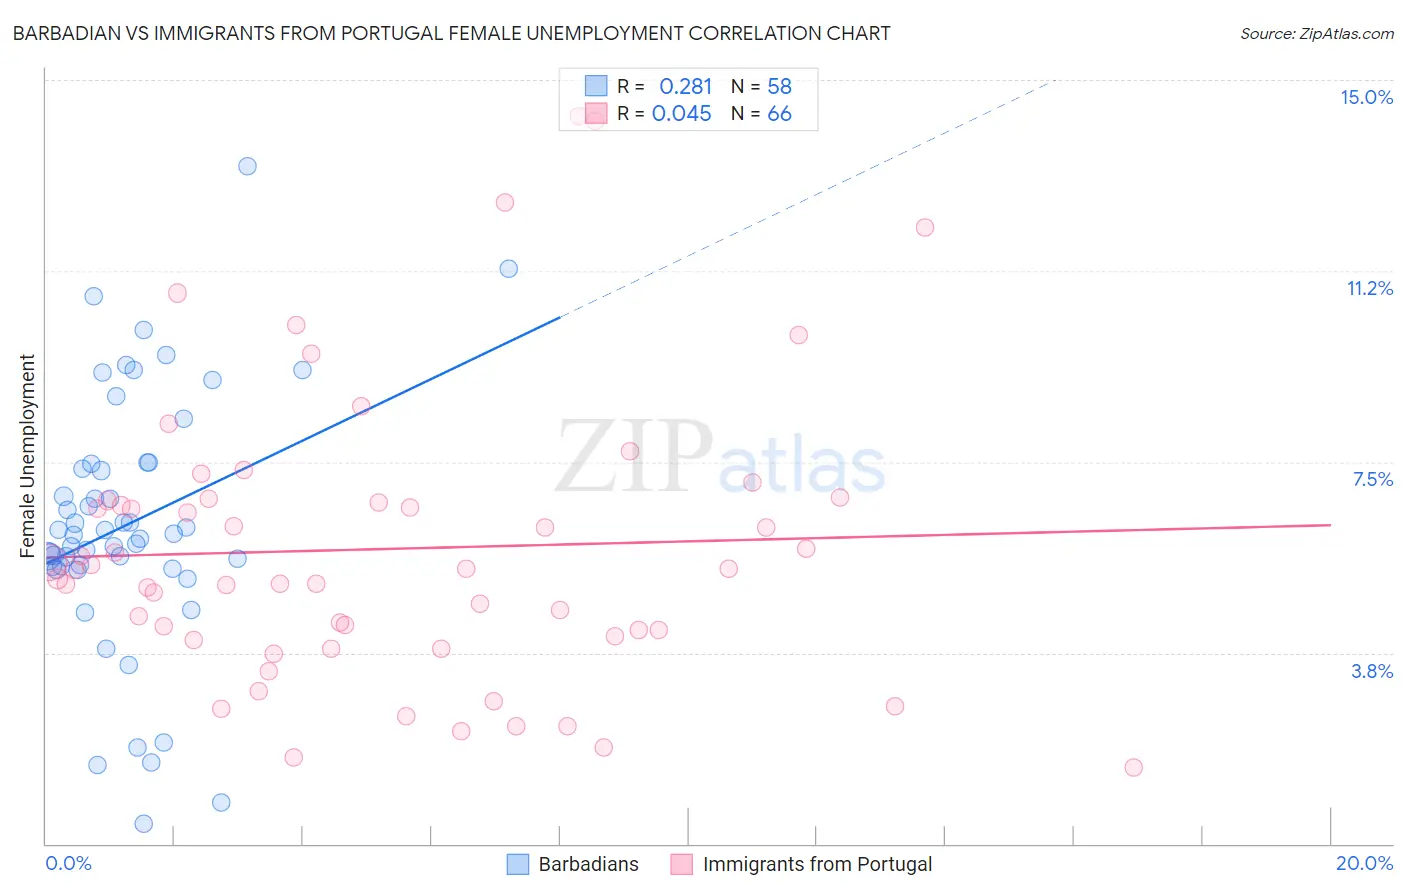
Barbadian vs Immigrants from Portugal Female Unemployment Correlation Chart
The statistical analysis conducted on geographies consisting of 141,186,778 people shows a weak positive correlation between the proportion of Barbadians and unemploymnet rate among females in the United States with a correlation coefficient (R) of 0.281 and weighted average of 6.2%. Similarly, the statistical analysis conducted on geographies consisting of 174,363,409 people shows no correlation between the proportion of Immigrants from Portugal and unemploymnet rate among females in the United States with a correlation coefficient (R) of 0.045 and weighted average of 5.8%, a difference of 7.6%.
Female Unemployment Correlation Summary
| Measurement | Barbadian | Immigrants from Portugal |
| Minimum | 0.40% | 1.5% |
| Maximum | 13.3% | 14.3% |
| Range | 12.9% | 12.8% |
| Mean | 6.3% | 5.8% |
| Median | 6.1% | 5.4% |
| Interquartile 25% (IQ1) | 5.4% | 4.1% |
| Interquartile 75% (IQ3) | 7.5% | 6.7% |
| Interquartile Range (IQR) | 2.0% | 2.7% |
| Standard Deviation (Sample) | 2.5% | 2.8% |
| Standard Deviation (Population) | 2.5% | 2.8% |
Similar Demographics by Female Unemployment
Demographics Similar to Barbadians by Female Unemployment
In terms of female unemployment, the demographic groups most similar to Barbadians are U.S. Virgin Islander (6.2%, a difference of 0.34%), Immigrants from Jamaica (6.2%, a difference of 0.37%), Spanish American Indian (6.2%, a difference of 0.42%), Immigrants from Barbados (6.2%, a difference of 0.50%), and Immigrants from Central America (6.2%, a difference of 0.58%).
| Demographics | Rating | Rank | Female Unemployment |
| Alaskan Athabascans | 0.0 /100 | #296 | Tragic 6.1% |
| West Indians | 0.0 /100 | #297 | Tragic 6.1% |
| Jamaicans | 0.0 /100 | #298 | Tragic 6.1% |
| Ute | 0.0 /100 | #299 | Tragic 6.1% |
| Immigrants | Haiti | 0.0 /100 | #300 | Tragic 6.1% |
| Immigrants | Barbados | 0.0 /100 | #301 | Tragic 6.2% |
| U.S. Virgin Islanders | 0.0 /100 | #302 | Tragic 6.2% |
| Barbadians | 0.0 /100 | #303 | Tragic 6.2% |
| Immigrants | Jamaica | 0.0 /100 | #304 | Tragic 6.2% |
| Spanish American Indians | 0.0 /100 | #305 | Tragic 6.2% |
| Immigrants | Central America | 0.0 /100 | #306 | Tragic 6.2% |
| Shoshone | 0.0 /100 | #307 | Tragic 6.2% |
| Hispanics or Latinos | 0.0 /100 | #308 | Tragic 6.2% |
| Ecuadorians | 0.0 /100 | #309 | Tragic 6.3% |
| Central American Indians | 0.0 /100 | #310 | Tragic 6.3% |
Demographics Similar to Immigrants from Portugal by Female Unemployment
In terms of female unemployment, the demographic groups most similar to Immigrants from Portugal are Immigrants from Fiji (5.8%, a difference of 0.11%), Nigerian (5.8%, a difference of 0.14%), Kiowa (5.8%, a difference of 0.41%), Immigrants from Nigeria (5.8%, a difference of 0.44%), and Dutch West Indian (5.7%, a difference of 0.81%).
| Demographics | Rating | Rank | Female Unemployment |
| Assyrians/Chaldeans/Syriacs | 0.8 /100 | #251 | Tragic 5.6% |
| Cajuns | 0.7 /100 | #252 | Tragic 5.7% |
| Immigrants | Sierra Leone | 0.6 /100 | #253 | Tragic 5.7% |
| Immigrants | Immigrants | 0.6 /100 | #254 | Tragic 5.7% |
| Immigrants | Cameroon | 0.6 /100 | #255 | Tragic 5.7% |
| Sub-Saharan Africans | 0.4 /100 | #256 | Tragic 5.7% |
| Dutch West Indians | 0.3 /100 | #257 | Tragic 5.7% |
| Immigrants | Portugal | 0.2 /100 | #258 | Tragic 5.8% |
| Immigrants | Fiji | 0.2 /100 | #259 | Tragic 5.8% |
| Nigerians | 0.2 /100 | #260 | Tragic 5.8% |
| Kiowa | 0.1 /100 | #261 | Tragic 5.8% |
| Immigrants | Nigeria | 0.1 /100 | #262 | Tragic 5.8% |
| Immigrants | Azores | 0.1 /100 | #263 | Tragic 5.8% |
| Immigrants | Bahamas | 0.1 /100 | #264 | Tragic 5.8% |
| Blackfeet | 0.0 /100 | #265 | Tragic 5.9% |