Bangladeshi vs Sri Lankan Unemployment Among Women with Children Under 6 years
COMPARE
Bangladeshi
Sri Lankan
Unemployment Among Women with Children Under 6 years
Unemployment Among Women with Children Under 6 years Comparison
Bangladeshis
Sri Lankans
7.5%
UNEMPLOYMENT AMONG WOMEN WITH CHILDREN UNDER 6 YEARS
74.8/ 100
METRIC RATING
152nd/ 347
METRIC RANK
6.6%
UNEMPLOYMENT AMONG WOMEN WITH CHILDREN UNDER 6 YEARS
100.0/ 100
METRIC RATING
37th/ 347
METRIC RANK
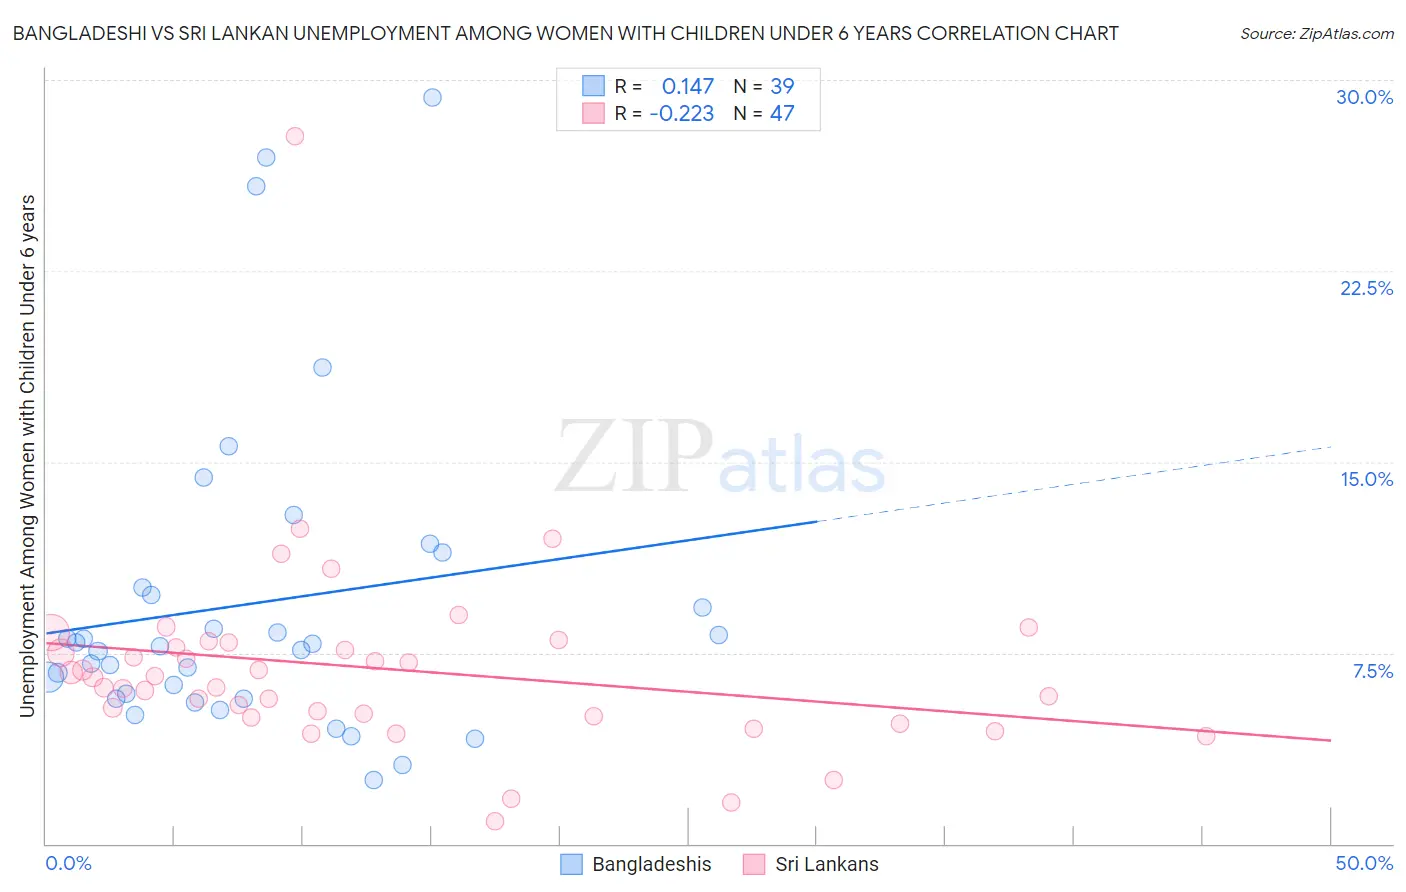
Bangladeshi vs Sri Lankan Unemployment Among Women with Children Under 6 years Correlation Chart
The statistical analysis conducted on geographies consisting of 122,945,375 people shows a poor positive correlation between the proportion of Bangladeshis and unemployment rate among women with children under the age of 6 in the United States with a correlation coefficient (R) of 0.147 and weighted average of 7.5%. Similarly, the statistical analysis conducted on geographies consisting of 330,167,868 people shows a weak negative correlation between the proportion of Sri Lankans and unemployment rate among women with children under the age of 6 in the United States with a correlation coefficient (R) of -0.223 and weighted average of 6.6%, a difference of 12.9%.
Unemployment Among Women with Children Under 6 years Correlation Summary
| Measurement | Bangladeshi | Sri Lankan |
| Minimum | 2.5% | 0.90% |
| Maximum | 29.3% | 27.8% |
| Range | 26.8% | 26.9% |
| Mean | 9.4% | 6.9% |
| Median | 7.7% | 6.5% |
| Interquartile 25% (IQ1) | 5.7% | 5.0% |
| Interquartile 75% (IQ3) | 10.1% | 7.9% |
| Interquartile Range (IQR) | 4.4% | 2.9% |
| Standard Deviation (Sample) | 6.2% | 3.9% |
| Standard Deviation (Population) | 6.1% | 3.9% |
Similar Demographics by Unemployment Among Women with Children Under 6 years
Demographics Similar to Bangladeshis by Unemployment Among Women with Children Under 6 years
In terms of unemployment among women with children under 6 years, the demographic groups most similar to Bangladeshis are Immigrants from Peru (7.5%, a difference of 0.010%), Uruguayan (7.5%, a difference of 0.010%), Northern European (7.5%, a difference of 0.040%), South American (7.5%, a difference of 0.060%), and Colombian (7.5%, a difference of 0.11%).
| Demographics | Rating | Rank | Unemployment Among Women with Children Under 6 years |
| Immigrants | Jordan | 78.9 /100 | #145 | Good 7.5% |
| Japanese | 78.9 /100 | #146 | Good 7.5% |
| Immigrants | Oceania | 78.4 /100 | #147 | Good 7.5% |
| Immigrants | Brazil | 77.3 /100 | #148 | Good 7.5% |
| Colombians | 76.1 /100 | #149 | Good 7.5% |
| Aleuts | 76.0 /100 | #150 | Good 7.5% |
| Immigrants | Peru | 74.9 /100 | #151 | Good 7.5% |
| Bangladeshis | 74.8 /100 | #152 | Good 7.5% |
| Uruguayans | 74.7 /100 | #153 | Good 7.5% |
| Northern Europeans | 74.3 /100 | #154 | Good 7.5% |
| South Americans | 74.1 /100 | #155 | Good 7.5% |
| Immigrants | Southern Europe | 73.2 /100 | #156 | Good 7.5% |
| Peruvians | 72.3 /100 | #157 | Good 7.5% |
| Croatians | 71.9 /100 | #158 | Good 7.5% |
| Immigrants | Philippines | 71.3 /100 | #159 | Good 7.5% |
Demographics Similar to Sri Lankans by Unemployment Among Women with Children Under 6 years
In terms of unemployment among women with children under 6 years, the demographic groups most similar to Sri Lankans are Hmong (6.7%, a difference of 0.13%), Immigrants from Russia (6.7%, a difference of 0.19%), Luxembourger (6.6%, a difference of 0.25%), Yakama (6.6%, a difference of 0.32%), and Asian (6.7%, a difference of 0.41%).
| Demographics | Rating | Rank | Unemployment Among Women with Children Under 6 years |
| Immigrants | Belarus | 100.0 /100 | #30 | Exceptional 6.6% |
| Immigrants | Moldova | 100.0 /100 | #31 | Exceptional 6.6% |
| Tsimshian | 100.0 /100 | #32 | Exceptional 6.6% |
| Immigrants | Vietnam | 100.0 /100 | #33 | Exceptional 6.6% |
| Immigrants | South Central Asia | 100.0 /100 | #34 | Exceptional 6.6% |
| Yakama | 100.0 /100 | #35 | Exceptional 6.6% |
| Luxembourgers | 100.0 /100 | #36 | Exceptional 6.6% |
| Sri Lankans | 100.0 /100 | #37 | Exceptional 6.6% |
| Hmong | 100.0 /100 | #38 | Exceptional 6.7% |
| Immigrants | Russia | 100.0 /100 | #39 | Exceptional 6.7% |
| Asians | 100.0 /100 | #40 | Exceptional 6.7% |
| Immigrants | Indonesia | 99.9 /100 | #41 | Exceptional 6.7% |
| Immigrants | Cuba | 99.9 /100 | #42 | Exceptional 6.7% |
| Bhutanese | 99.9 /100 | #43 | Exceptional 6.7% |
| Iranians | 99.9 /100 | #44 | Exceptional 6.7% |