Bangladeshi vs Immigrants from Spain Unemployment

COMPARE

Bangladeshi
Race
Ancestry
AfghanAfricanAlaska NativeAlaskan AthabascanAlbanianAleutAlsatianAmericanApacheArabArapahoArgentineanArmenianAssyrian/Chaldean/SyriacAustralianAustrianBahamianBangladeshiBarbadianBasqueBelgianBelizeanBermudanBhutaneseBlackfeetBolivianBrazilianBritishBritish West IndianBulgarianBurmeseCajunCambodianCanadianCape VerdeanCarpatho RusynCelticCentral AmericanCentral American IndianCherokeeCheyenneChickasawChileanChineseChippewaChoctawColombianColvilleComancheCosta RicanCreeCreekCroatianCrowCubanCypriotCzechCzechoslovakianDanishDelawareDominicanDutchDutch West IndianEastern EuropeanEcuadorianEgyptianEnglishEstonianEthiopianEuropeanFijianFilipinoFinnishFrenchFrench American IndianFrench CanadianGermanGerman RussianGhanaianGreekGuamanian/ChamorroGuatemalanGuyaneseHaitianHmongHonduranHopiHoumaHungarianIcelanderIndian (Asian)IndonesianInupiatIranianIraqiIrishIroquoisIsraeliItalianJamaicanJapaneseJordanianKenyanKiowaKoreanLaotianLatvianLebaneseLiberianLithuanianLumbeeLuxembourgerMacedonianMalaysianMalteseMarshalleseMenomineeMexicanMexican American IndianMongolianMoroccanNative HawaiianNavajoNepaleseNew ZealanderNicaraguanNigerianNorthern EuropeanNorwegianOkinawanOsageOttawaPaiutePakistaniPalestinianPanamanianParaguayanPennsylvania GermanPeruvianPimaPolishPortuguesePotawatomiPuebloPuerto RicanPuget Sound SalishRomanianRussianSalvadoranSamoanScandinavianScotch-IrishScottishSeminoleSenegaleseSerbianShoshoneSierra LeoneanSiouxSlavicSlovakSloveneSomaliSouth AfricanSouth AmericanSouth American IndianSoviet UnionSpaniardSpanishSpanish AmericanSpanish American IndianSri LankanSubsaharan AfricanSudaneseSwedishSwissSyrianTaiwaneseThaiTlingit-HaidaTohono O'OdhamTonganTrinidadian and TobagonianTsimshianTurkishU.S. Virgin IslanderUgandanUkrainianUruguayanUteVenezuelanVietnameseWelshWest IndianYakamaYaquiYugoslavianYumanYup'ikZimbabwean
Immigration
NonimmigrantsImmigrantsAfghanistanAfricaAlbaniaArgentinaArmeniaAsiaAustraliaAustriaBahamasBangladeshBarbadosBelarusBelgiumBelizeBoliviaBosnia and HerzegovinaBrazilBulgariaBurma/MyanmarCabo VerdeCambodiaCameroonCanadaCaribbeanCentral AmericaChileChinaColombiaCongoCosta RicaCroatiaCubaCzechoslovakiaDenmarkDominicaDominican RepublicEastern AfricaEastern AsiaEastern EuropeEcuadorEgyptEl SalvadorEnglandEritreaEthiopiaEuropeFijiFranceGermanyGhanaGreeceGrenadaGuatemalaGuyanaHaitiHondurasHong KongHungaryIndiaIndonesiaIranIraqIrelandIsraelItalyJamaicaJapanJordanKazakhstanKenyaKoreaKuwaitLaosLatin AmericaLatviaLebanonLiberiaLithuaniaMalaysiaMexicoMicronesiaMiddle AfricaMoldovaMoroccoNepalNetherlandsNicaraguaNigeriaNorth AmericaNorth MacedoniaNorthern AfricaNorthern EuropeNorwayOceaniaPakistanPanamaPeruPhilippinesPolandPortugalRomaniaRussiaSaudi ArabiaScotlandSenegalSerbiaSierra LeoneSingaporeSomaliaSouth AfricaSouth AmericaSouth Central AsiaSouth Eastern AsiaSouthern EuropeSri LankaSt. Vincent and the GrenadinesSudanSwedenSwitzerlandSyriaTaiwanThailandTrinidad and TobagoTurkeyUgandaUkraineUruguayUzbekistanVenezuelaVietnamWest IndiesWestern AfricaWestern AsiaWestern EuropeYemenZaireZimbabweAzores
Immigrants from Spain
Race
Ancestry
AfghanAfricanAlaska NativeAlaskan AthabascanAlbanianAleutAlsatianAmericanApacheArabArapahoArgentineanArmenianAssyrian/Chaldean/SyriacAustralianAustrianBahamianBarbadianBasqueBelgianBelizeanBermudanBhutaneseBlackfeetBolivianBrazilianBritishBritish West IndianBulgarianBurmeseCajunCambodianCanadianCape VerdeanCarpatho RusynCelticCentral AmericanCentral American IndianCherokeeCheyenneChickasawChileanChineseChippewaChoctawColombianColvilleComancheCosta RicanCreeCreekCroatianCrowCubanCypriotCzechCzechoslovakianDanishDelawareDominicanDutchDutch West IndianEastern EuropeanEcuadorianEgyptianEnglishEstonianEthiopianEuropeanFijianFilipinoFinnishFrenchFrench American IndianFrench CanadianGermanGerman RussianGhanaianGreekGuamanian/ChamorroGuatemalanGuyaneseHaitianHmongHonduranHopiHoumaHungarianIcelanderIndian (Asian)IndonesianInupiatIranianIraqiIrishIroquoisIsraeliItalianJamaicanJapaneseJordanianKenyanKiowaKoreanLaotianLatvianLebaneseLiberianLithuanianLumbeeLuxembourgerMacedonianMalaysianMalteseMarshalleseMenomineeMexicanMexican American IndianMongolianMoroccanNative HawaiianNavajoNepaleseNew ZealanderNicaraguanNigerianNorthern EuropeanNorwegianOkinawanOsageOttawaPaiutePakistaniPalestinianPanamanianParaguayanPennsylvania GermanPeruvianPimaPolishPortuguesePotawatomiPuebloPuerto RicanPuget Sound SalishRomanianRussianSalvadoranSamoanScandinavianScotch-IrishScottishSeminoleSenegaleseSerbianShoshoneSierra LeoneanSiouxSlavicSlovakSloveneSomaliSouth AfricanSouth AmericanSouth American IndianSoviet UnionSpaniardSpanishSpanish AmericanSpanish American IndianSri LankanSubsaharan AfricanSudaneseSwedishSwissSyrianTaiwaneseThaiTlingit-HaidaTohono O'OdhamTonganTrinidadian and TobagonianTsimshianTurkishU.S. Virgin IslanderUgandanUkrainianUruguayanUteVenezuelanVietnameseWelshWest IndianYakamaYaquiYugoslavianYumanYup'ikZimbabwean
Immigration
NonimmigrantsImmigrantsAfghanistanAfricaAlbaniaArgentinaArmeniaAsiaAustraliaAustriaBahamasBangladeshBarbadosBelarusBelgiumBelizeBoliviaBosnia and HerzegovinaBrazilBulgariaBurma/MyanmarCabo VerdeCambodiaCameroonCanadaCaribbeanCentral AmericaChileChinaColombiaCongoCosta RicaCroatiaCubaCzechoslovakiaDenmarkDominicaDominican RepublicEastern AfricaEastern AsiaEastern EuropeEcuadorEgyptEl SalvadorEnglandEritreaEthiopiaEuropeFijiFranceGermanyGhanaGreeceGrenadaGuatemalaGuyanaHaitiHondurasHong KongHungaryIndiaIndonesiaIranIraqIrelandIsraelItalyJamaicaJapanJordanKazakhstanKenyaKoreaKuwaitLaosLatin AmericaLatviaLebanonLiberiaLithuaniaMalaysiaMexicoMicronesiaMiddle AfricaMoldovaMoroccoNepalNetherlandsNicaraguaNigeriaNorth AmericaNorth MacedoniaNorthern AfricaNorthern EuropeNorwayOceaniaPakistanPanamaPeruPhilippinesPolandPortugalRomaniaRussiaSaudi ArabiaScotlandSenegalSerbiaSierra LeoneSingaporeSomaliaSouth AfricaSouth AmericaSouth Central AsiaSouth Eastern AsiaSouthern EuropeSpainSri LankaSt. Vincent and the GrenadinesSudanSwedenSwitzerlandSyriaTaiwanThailandTrinidad and TobagoTurkeyUgandaUkraineUruguayUzbekistanVenezuelaVietnamWest IndiesWestern AfricaWestern AsiaWestern EuropeYemenZaireZimbabweAzores
Unemployment
Income
Poverty
Unemployment
Labor Participation
Family Structure
Vehicle Availability
Education Level
Disability

Unemployment Comparison

Bangladeshis

Immigrants from Spain

Poor
Excellent
5.4%
UNEMPLOYMENT
11.2/ 100
METRIC RATING
219th/ 347
METRIC RANK
5.1%
UNEMPLOYMENT
86.2/ 100
METRIC RATING
136th/ 347
METRIC RANK

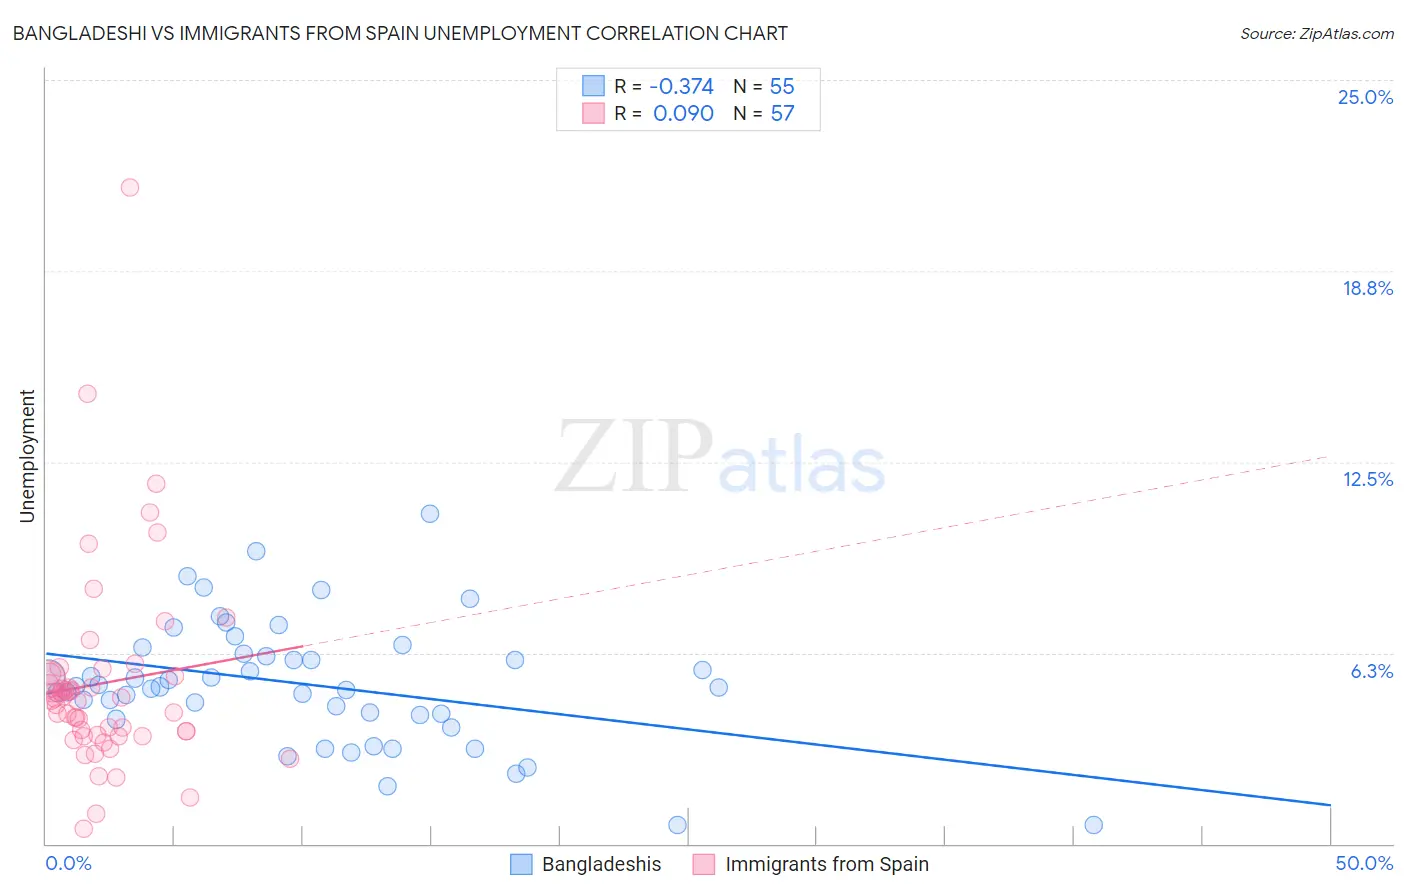
Bangladeshi vs Immigrants from Spain Unemployment Correlation Chart

The statistical analysis conducted on geographies consisting of 141,326,736 people shows a mild negative correlation between the proportion of Bangladeshis and unemployment in the United States with a correlation coefficient (R) of -0.374 and weighted average of 5.4%. Similarly, the statistical analysis conducted on geographies consisting of 239,621,444 people shows a slight positive correlation between the proportion of Immigrants from Spain and unemployment in the United States with a correlation coefficient (R) of 0.090 and weighted average of 5.1%, a difference of 6.2%.
Bangladeshi vs Immigrants from Spain Unemployment

Unemployment Correlation Summary

MeasurementBangladeshiImmigrants from Spain
Minimum0.60%0.50%
Maximum10.8%21.5%
Range10.2%21.0%
Mean5.2%5.3%
Median5.1%4.7%
Interquartile 25% (IQ1)4.2%3.5%
Interquartile 75% (IQ3)6.2%5.5%
Interquartile Range (IQR)2.0%2.0%
Standard Deviation (Sample)2.0%3.4%
Standard Deviation (Population)2.0%3.3%

Similar Demographics by Unemployment

Demographics Similar to Bangladeshis by Unemployment

In terms of unemployment, the demographic groups most similar to Bangladeshis are Soviet Union (5.4%, a difference of 0.080%), Immigrants from Philippines (5.4%, a difference of 0.12%), Iroquois (5.4%, a difference of 0.14%), Choctaw (5.4%, a difference of 0.22%), and Immigrants from South America (5.4%, a difference of 0.32%).
DemographicsRating | RankUnemployment
Ugandans
18.0
/100
|
#212
Poor
5.4%
Immigrants | Middle Africa
15.3
/100
|
#213
Poor
5.4%
Immigrants | Costa Rica
15.2
/100
|
#214
Poor
5.4%
Delaware
14.7
/100
|
#215
Poor
5.4%
Immigrants | South America
13.5
/100
|
#216
Poor
5.4%
Immigrants | Albania
13.5
/100
|
#217
Poor
5.4%
Choctaw
12.7
/100
|
#218
Poor
5.4%
Bangladeshis
11.2
/100
|
#219
Poor
5.4%
Soviet Union
10.6
/100
|
#220
Poor
5.4%
Immigrants | Philippines
10.4
/100
|
#221
Poor
5.4%
Iroquois
10.3
/100
|
#222
Poor
5.4%
Seminole
9.2
/100
|
#223
Tragic
5.4%
Israelis
8.8
/100
|
#224
Tragic
5.4%
South American Indians
7.8
/100
|
#225
Tragic
5.5%
Samoans
7.1
/100
|
#226
Tragic
5.5%

Demographics Similar to Immigrants from Spain by Unemployment

In terms of unemployment, the demographic groups most similar to Immigrants from Spain are Immigrants from Europe (5.1%, a difference of 0.010%), Immigrants from Burma/Myanmar (5.1%, a difference of 0.010%), Immigrants from Jordan (5.1%, a difference of 0.060%), Immigrants from Croatia (5.1%, a difference of 0.070%), and Immigrants from Ethiopia (5.1%, a difference of 0.070%).
DemographicsRating | RankUnemployment
Immigrants | Latvia
88.0
/100
|
#129
Excellent
5.1%
Iranians
86.9
/100
|
#130
Excellent
5.1%
Immigrants | Croatia
86.8
/100
|
#131
Excellent
5.1%
Immigrants | Ethiopia
86.7
/100
|
#132
Excellent
5.1%
Immigrants | Jordan
86.6
/100
|
#133
Excellent
5.1%
Immigrants | Europe
86.3
/100
|
#134
Excellent
5.1%
Immigrants | Burma/Myanmar
86.2
/100
|
#135
Excellent
5.1%
Immigrants | Spain
86.2
/100
|
#136
Excellent
5.1%
Immigrants | Saudi Arabia
85.6
/100
|
#137
Excellent
5.1%
Immigrants | Hungary
85.6
/100
|
#138
Excellent
5.1%
Pakistanis
85.3
/100
|
#139
Excellent
5.1%
Immigrants | Denmark
84.3
/100
|
#140
Excellent
5.1%
Palestinians
83.4
/100
|
#141
Excellent
5.1%
Immigrants | Pakistan
83.2
/100
|
#142
Excellent
5.1%
Immigrants | Chile
82.8
/100
|
#143
Excellent
5.1%