Austrian vs Tlingit-Haida Unemployment Among Women with Children Under 6 years

COMPARE

Austrian
Race
Ancestry
AfghanAfricanAlaska NativeAlaskan AthabascanAlbanianAleutAlsatianAmericanApacheArabArapahoArgentineanArmenianAssyrian/Chaldean/SyriacAustralianAustrianBahamianBangladeshiBarbadianBasqueBelgianBelizeanBermudanBhutaneseBlackfeetBolivianBrazilianBritishBritish West IndianBulgarianBurmeseCajunCambodianCanadianCape VerdeanCarpatho RusynCelticCentral AmericanCentral American IndianCherokeeCheyenneChickasawChileanChineseChippewaChoctawColombianColvilleComancheCosta RicanCreeCreekCroatianCrowCubanCypriotCzechCzechoslovakianDanishDelawareDominicanDutchDutch West IndianEastern EuropeanEcuadorianEgyptianEnglishEstonianEthiopianEuropeanFijianFilipinoFinnishFrenchFrench American IndianFrench CanadianGermanGerman RussianGhanaianGreekGuamanian/ChamorroGuatemalanGuyaneseHaitianHmongHonduranHopiHoumaHungarianIcelanderIndian (Asian)IndonesianInupiatIranianIraqiIrishIroquoisIsraeliItalianJamaicanJapaneseJordanianKenyanKiowaKoreanLaotianLatvianLebaneseLiberianLithuanianLumbeeLuxembourgerMacedonianMalaysianMalteseMarshalleseMenomineeMexicanMexican American IndianMongolianMoroccanNative HawaiianNavajoNepaleseNew ZealanderNicaraguanNigerianNorthern EuropeanNorwegianOkinawanOsageOttawaPaiutePakistaniPalestinianPanamanianParaguayanPennsylvania GermanPeruvianPimaPolishPortuguesePotawatomiPuebloPuerto RicanPuget Sound SalishRomanianRussianSalvadoranSamoanScandinavianScotch-IrishScottishSeminoleSenegaleseSerbianShoshoneSierra LeoneanSiouxSlavicSlovakSloveneSomaliSouth AfricanSouth AmericanSouth American IndianSoviet UnionSpaniardSpanishSpanish AmericanSpanish American IndianSri LankanSubsaharan AfricanSudaneseSwedishSwissSyrianTaiwaneseThaiTohono O'OdhamTonganTrinidadian and TobagonianTsimshianTurkishU.S. Virgin IslanderUgandanUkrainianUruguayanUteVenezuelanVietnameseWelshWest IndianYakamaYaquiYugoslavianYumanYup'ikZimbabwean
Immigration
NonimmigrantsImmigrantsAfghanistanAfricaAlbaniaArgentinaArmeniaAsiaAustraliaAustriaBahamasBangladeshBarbadosBelarusBelgiumBelizeBoliviaBosnia and HerzegovinaBrazilBulgariaBurma/MyanmarCabo VerdeCambodiaCameroonCanadaCaribbeanCentral AmericaChileChinaColombiaCongoCosta RicaCroatiaCubaCzechoslovakiaDenmarkDominicaDominican RepublicEastern AfricaEastern AsiaEastern EuropeEcuadorEgyptEl SalvadorEnglandEritreaEthiopiaEuropeFijiFranceGermanyGhanaGreeceGrenadaGuatemalaGuyanaHaitiHondurasHong KongHungaryIndiaIndonesiaIranIraqIrelandIsraelItalyJamaicaJapanJordanKazakhstanKenyaKoreaKuwaitLaosLatin AmericaLatviaLebanonLiberiaLithuaniaMalaysiaMexicoMicronesiaMiddle AfricaMoldovaMoroccoNepalNetherlandsNicaraguaNigeriaNorth AmericaNorth MacedoniaNorthern AfricaNorthern EuropeNorwayOceaniaPakistanPanamaPeruPhilippinesPolandPortugalRomaniaRussiaSaudi ArabiaScotlandSenegalSerbiaSierra LeoneSingaporeSomaliaSouth AfricaSouth AmericaSouth Central AsiaSouth Eastern AsiaSouthern EuropeSpainSri LankaSt. Vincent and the GrenadinesSudanSwedenSwitzerlandSyriaTaiwanThailandTrinidad and TobagoTurkeyUgandaUkraineUruguayUzbekistanVenezuelaVietnamWest IndiesWestern AfricaWestern AsiaWestern EuropeYemenZaireZimbabweAzores
Tlingit-Haida
Race
Ancestry
AfghanAfricanAlaska NativeAlaskan AthabascanAlbanianAleutAlsatianAmericanApacheArabArapahoArgentineanArmenianAssyrian/Chaldean/SyriacAustralianBahamianBangladeshiBarbadianBasqueBelgianBelizeanBermudanBhutaneseBlackfeetBolivianBrazilianBritishBritish West IndianBulgarianBurmeseCajunCambodianCanadianCape VerdeanCarpatho RusynCelticCentral AmericanCentral American IndianCherokeeCheyenneChickasawChileanChineseChippewaChoctawColombianColvilleComancheCosta RicanCreeCreekCroatianCrowCubanCypriotCzechCzechoslovakianDanishDelawareDominicanDutchDutch West IndianEastern EuropeanEcuadorianEgyptianEnglishEstonianEthiopianEuropeanFijianFilipinoFinnishFrenchFrench American IndianFrench CanadianGermanGerman RussianGhanaianGreekGuamanian/ChamorroGuatemalanGuyaneseHaitianHmongHonduranHopiHoumaHungarianIcelanderIndian (Asian)IndonesianInupiatIranianIraqiIrishIroquoisIsraeliItalianJamaicanJapaneseJordanianKenyanKiowaKoreanLaotianLatvianLebaneseLiberianLithuanianLumbeeLuxembourgerMacedonianMalaysianMalteseMarshalleseMenomineeMexicanMexican American IndianMongolianMoroccanNative HawaiianNavajoNepaleseNew ZealanderNicaraguanNigerianNorthern EuropeanNorwegianOkinawanOsageOttawaPaiutePakistaniPalestinianPanamanianParaguayanPennsylvania GermanPeruvianPimaPolishPortuguesePotawatomiPuebloPuerto RicanPuget Sound SalishRomanianRussianSalvadoranSamoanScandinavianScotch-IrishScottishSeminoleSenegaleseSerbianShoshoneSierra LeoneanSiouxSlavicSlovakSloveneSomaliSouth AfricanSouth AmericanSouth American IndianSoviet UnionSpaniardSpanishSpanish AmericanSpanish American IndianSri LankanSubsaharan AfricanSudaneseSwedishSwissSyrianTaiwaneseThaiTlingit-HaidaTohono O'OdhamTonganTrinidadian and TobagonianTsimshianTurkishU.S. Virgin IslanderUgandanUkrainianUruguayanUteVenezuelanVietnameseWelshWest IndianYakamaYaquiYugoslavianYumanYup'ikZimbabwean
Immigration
NonimmigrantsImmigrantsAfghanistanAfricaAlbaniaArgentinaArmeniaAsiaAustraliaAustriaBahamasBangladeshBarbadosBelarusBelgiumBelizeBoliviaBosnia and HerzegovinaBrazilBulgariaBurma/MyanmarCabo VerdeCambodiaCameroonCanadaCaribbeanCentral AmericaChileChinaColombiaCongoCosta RicaCroatiaCubaCzechoslovakiaDenmarkDominicaDominican RepublicEastern AfricaEastern AsiaEastern EuropeEcuadorEgyptEl SalvadorEnglandEritreaEthiopiaEuropeFijiFranceGermanyGhanaGreeceGrenadaGuatemalaGuyanaHaitiHondurasHong KongHungaryIndiaIndonesiaIranIraqIrelandIsraelItalyJamaicaJapanJordanKazakhstanKenyaKoreaKuwaitLaosLatin AmericaLatviaLebanonLiberiaLithuaniaMalaysiaMexicoMicronesiaMiddle AfricaMoldovaMoroccoNepalNetherlandsNicaraguaNigeriaNorth AmericaNorth MacedoniaNorthern AfricaNorthern EuropeNorwayOceaniaPakistanPanamaPeruPhilippinesPolandPortugalRomaniaRussiaSaudi ArabiaScotlandSenegalSerbiaSierra LeoneSingaporeSomaliaSouth AfricaSouth AmericaSouth Central AsiaSouth Eastern AsiaSouthern EuropeSpainSri LankaSt. Vincent and the GrenadinesSudanSwedenSwitzerlandSyriaTaiwanThailandTrinidad and TobagoTurkeyUgandaUkraineUruguayUzbekistanVenezuelaVietnamWest IndiesWestern AfricaWestern AsiaWestern EuropeYemenZaireZimbabweAzores
Unemployment Among Women with Children Under 6 years
Income
Poverty
Unemployment
Labor Participation
Family Structure
Vehicle Availability
Education Level
Disability

Unemployment Among Women with Children Under 6 years Comparison

Austrians

Tlingit-Haida

Average
Tragic
7.7%
UNEMPLOYMENT AMONG WOMEN WITH CHILDREN UNDER 6 YEARS
46.0/ 100
METRIC RATING
177th/ 347
METRIC RANK
8.9%
UNEMPLOYMENT AMONG WOMEN WITH CHILDREN UNDER 6 YEARS
0.0/ 100
METRIC RATING
298th/ 347
METRIC RANK

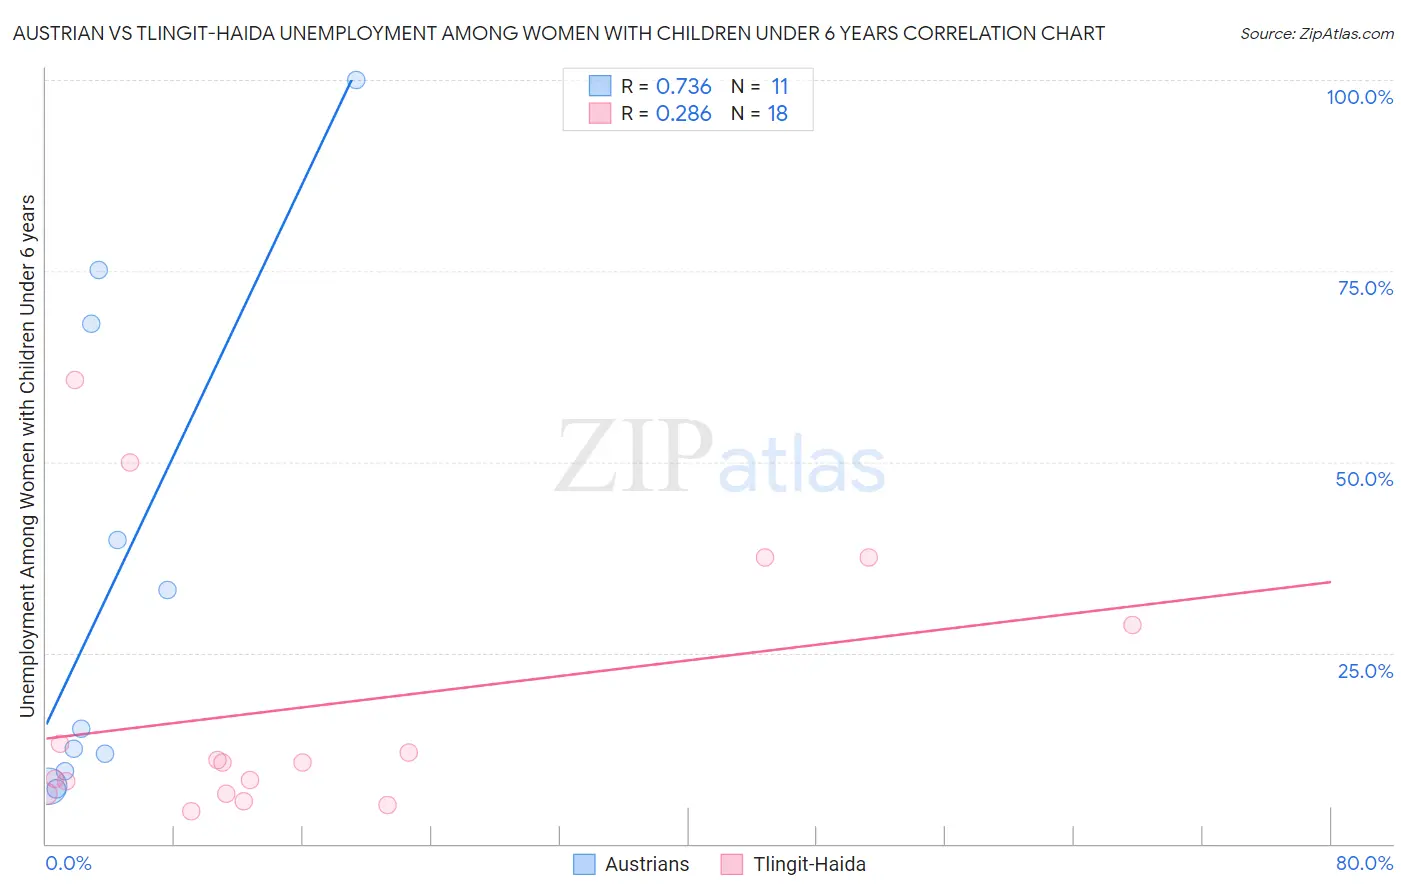
Austrian vs Tlingit-Haida Unemployment Among Women with Children Under 6 years Correlation Chart

The statistical analysis conducted on geographies consisting of 322,238,439 people shows a strong positive correlation between the proportion of Austrians and unemployment rate among women with children under the age of 6 in the United States with a correlation coefficient (R) of 0.736 and weighted average of 7.7%. Similarly, the statistical analysis conducted on geographies consisting of 54,546,632 people shows a weak positive correlation between the proportion of Tlingit-Haida and unemployment rate among women with children under the age of 6 in the United States with a correlation coefficient (R) of 0.286 and weighted average of 8.9%, a difference of 16.0%.
Austrian vs Tlingit-Haida Unemployment Among Women with Children Under 6 years

Unemployment Among Women with Children Under 6 years Correlation Summary

MeasurementAustrianTlingit-Haida
Minimum7.2%4.3%
Maximum100.0%60.7%
Range92.8%56.4%
Mean34.5%18.0%
Median15.0%10.6%
Interquartile 25% (IQ1)9.5%6.5%
Interquartile 75% (IQ3)68.1%28.6%
Interquartile Range (IQR)58.6%22.1%
Standard Deviation (Sample)32.5%17.1%
Standard Deviation (Population)31.0%16.6%

Similar Demographics by Unemployment Among Women with Children Under 6 years

Demographics Similar to Austrians by Unemployment Among Women with Children Under 6 years

In terms of unemployment among women with children under 6 years, the demographic groups most similar to Austrians are Immigrants from England (7.7%, a difference of 0.040%), Immigrants from Western Europe (7.7%, a difference of 0.070%), Immigrants from Uruguay (7.7%, a difference of 0.10%), Puget Sound Salish (7.7%, a difference of 0.12%), and Brazilian (7.7%, a difference of 0.14%).
DemographicsRating | RankUnemployment Among Women with Children Under 6 years
Czechs
59.8
/100
|
#170
Average
7.6%
Immigrants | Grenada
59.0
/100
|
#171
Average
7.6%
Immigrants | North America
57.7
/100
|
#172
Average
7.6%
Cree
51.6
/100
|
#173
Average
7.6%
Immigrants | Laos
50.0
/100
|
#174
Average
7.6%
Panamanians
49.6
/100
|
#175
Average
7.6%
Puget Sound Salish
47.7
/100
|
#176
Average
7.7%
Austrians
46.0
/100
|
#177
Average
7.7%
Immigrants | England
45.4
/100
|
#178
Average
7.7%
Immigrants | Western Europe
44.9
/100
|
#179
Average
7.7%
Immigrants | Uruguay
44.5
/100
|
#180
Average
7.7%
Brazilians
43.9
/100
|
#181
Average
7.7%
Nepalese
43.5
/100
|
#182
Average
7.7%
Sierra Leoneans
42.9
/100
|
#183
Average
7.7%
Indonesians
40.5
/100
|
#184
Average
7.7%

Demographics Similar to Tlingit-Haida by Unemployment Among Women with Children Under 6 years

In terms of unemployment among women with children under 6 years, the demographic groups most similar to Tlingit-Haida are Mexican (8.9%, a difference of 0.16%), Immigrants from Jamaica (8.9%, a difference of 0.21%), Immigrants from Dominican Republic (8.9%, a difference of 0.25%), Creek (8.9%, a difference of 0.30%), and Immigrants from Central America (8.9%, a difference of 0.39%).
DemographicsRating | RankUnemployment Among Women with Children Under 6 years
Jamaicans
0.0
/100
|
#291
Tragic
8.8%
Cheyenne
0.0
/100
|
#292
Tragic
8.8%
Immigrants | Bangladesh
0.0
/100
|
#293
Tragic
8.8%
Immigrants | Nonimmigrants
0.0
/100
|
#294
Tragic
8.8%
Immigrants | Central America
0.0
/100
|
#295
Tragic
8.9%
Immigrants | Dominican Republic
0.0
/100
|
#296
Tragic
8.9%
Mexicans
0.0
/100
|
#297
Tragic
8.9%
Tlingit-Haida
0.0
/100
|
#298
Tragic
8.9%
Immigrants | Jamaica
0.0
/100
|
#299
Tragic
8.9%
Creek
0.0
/100
|
#300
Tragic
8.9%
Chickasaw
0.0
/100
|
#301
Tragic
9.0%
Hispanics or Latinos
0.0
/100
|
#302
Tragic
9.0%
Immigrants | West Indies
0.0
/100
|
#303
Tragic
9.0%
Immigrants | Mexico
0.0
/100
|
#304
Tragic
9.1%
Alaskan Athabascans
0.0
/100
|
#305
Tragic
9.1%