Austrian vs Immigrants from South Africa Unemployment

COMPARE

Austrian
Race
Ancestry
AfghanAfricanAlaska NativeAlaskan AthabascanAlbanianAleutAlsatianAmericanApacheArabArapahoArgentineanArmenianAssyrian/Chaldean/SyriacAustralianAustrianBahamianBangladeshiBarbadianBasqueBelgianBelizeanBermudanBhutaneseBlackfeetBolivianBrazilianBritishBritish West IndianBulgarianBurmeseCajunCambodianCanadianCape VerdeanCarpatho RusynCelticCentral AmericanCentral American IndianCherokeeCheyenneChickasawChileanChineseChippewaChoctawColombianColvilleComancheCosta RicanCreeCreekCroatianCrowCubanCypriotCzechCzechoslovakianDanishDelawareDominicanDutchDutch West IndianEastern EuropeanEcuadorianEgyptianEnglishEstonianEthiopianEuropeanFijianFilipinoFinnishFrenchFrench American IndianFrench CanadianGermanGerman RussianGhanaianGreekGuamanian/ChamorroGuatemalanGuyaneseHaitianHmongHonduranHopiHoumaHungarianIcelanderIndian (Asian)IndonesianInupiatIranianIraqiIrishIroquoisIsraeliItalianJamaicanJapaneseJordanianKenyanKiowaKoreanLaotianLatvianLebaneseLiberianLithuanianLumbeeLuxembourgerMacedonianMalaysianMalteseMarshalleseMenomineeMexicanMexican American IndianMongolianMoroccanNative HawaiianNavajoNepaleseNew ZealanderNicaraguanNigerianNorthern EuropeanNorwegianOkinawanOsageOttawaPaiutePakistaniPalestinianPanamanianParaguayanPennsylvania GermanPeruvianPimaPolishPortuguesePotawatomiPuebloPuerto RicanPuget Sound SalishRomanianRussianSalvadoranSamoanScandinavianScotch-IrishScottishSeminoleSenegaleseSerbianShoshoneSierra LeoneanSiouxSlavicSlovakSloveneSomaliSouth AfricanSouth AmericanSouth American IndianSoviet UnionSpaniardSpanishSpanish AmericanSpanish American IndianSri LankanSubsaharan AfricanSudaneseSwedishSwissSyrianTaiwaneseThaiTlingit-HaidaTohono O'OdhamTonganTrinidadian and TobagonianTsimshianTurkishU.S. Virgin IslanderUgandanUkrainianUruguayanUteVenezuelanVietnameseWelshWest IndianYakamaYaquiYugoslavianYumanYup'ikZimbabwean
Immigration
NonimmigrantsImmigrantsAfghanistanAfricaAlbaniaArgentinaArmeniaAsiaAustraliaAustriaBahamasBangladeshBarbadosBelarusBelgiumBelizeBoliviaBosnia and HerzegovinaBrazilBulgariaBurma/MyanmarCabo VerdeCambodiaCameroonCanadaCaribbeanCentral AmericaChileChinaColombiaCongoCosta RicaCroatiaCubaCzechoslovakiaDenmarkDominicaDominican RepublicEastern AfricaEastern AsiaEastern EuropeEcuadorEgyptEl SalvadorEnglandEritreaEthiopiaEuropeFijiFranceGermanyGhanaGreeceGrenadaGuatemalaGuyanaHaitiHondurasHong KongHungaryIndiaIndonesiaIranIraqIrelandIsraelItalyJamaicaJapanJordanKazakhstanKenyaKoreaKuwaitLaosLatin AmericaLatviaLebanonLiberiaLithuaniaMalaysiaMexicoMicronesiaMiddle AfricaMoldovaMoroccoNepalNetherlandsNicaraguaNigeriaNorth AmericaNorth MacedoniaNorthern AfricaNorthern EuropeNorwayOceaniaPakistanPanamaPeruPhilippinesPolandPortugalRomaniaRussiaSaudi ArabiaScotlandSenegalSerbiaSierra LeoneSingaporeSomaliaSouth AmericaSouth Central AsiaSouth Eastern AsiaSouthern EuropeSpainSri LankaSt. Vincent and the GrenadinesSudanSwedenSwitzerlandSyriaTaiwanThailandTrinidad and TobagoTurkeyUgandaUkraineUruguayUzbekistanVenezuelaVietnamWest IndiesWestern AfricaWestern AsiaWestern EuropeYemenZaireZimbabweAzores
Immigrants from South Africa
Race
Ancestry
AfghanAfricanAlaska NativeAlaskan AthabascanAlbanianAleutAlsatianAmericanApacheArabArapahoArgentineanArmenianAssyrian/Chaldean/SyriacAustralianBahamianBangladeshiBarbadianBasqueBelgianBelizeanBermudanBhutaneseBlackfeetBolivianBrazilianBritishBritish West IndianBulgarianBurmeseCajunCambodianCanadianCape VerdeanCarpatho RusynCelticCentral AmericanCentral American IndianCherokeeCheyenneChickasawChileanChineseChippewaChoctawColombianColvilleComancheCosta RicanCreeCreekCroatianCrowCubanCypriotCzechCzechoslovakianDanishDelawareDominicanDutchDutch West IndianEastern EuropeanEcuadorianEgyptianEnglishEstonianEthiopianEuropeanFijianFilipinoFinnishFrenchFrench American IndianFrench CanadianGermanGerman RussianGhanaianGreekGuamanian/ChamorroGuatemalanGuyaneseHaitianHmongHonduranHopiHoumaHungarianIcelanderIndian (Asian)IndonesianInupiatIranianIraqiIrishIroquoisIsraeliItalianJamaicanJapaneseJordanianKenyanKiowaKoreanLaotianLatvianLebaneseLiberianLithuanianLumbeeLuxembourgerMacedonianMalaysianMalteseMarshalleseMenomineeMexicanMexican American IndianMongolianMoroccanNative HawaiianNavajoNepaleseNew ZealanderNicaraguanNigerianNorthern EuropeanNorwegianOkinawanOsageOttawaPaiutePakistaniPalestinianPanamanianParaguayanPennsylvania GermanPeruvianPimaPolishPortuguesePotawatomiPuebloPuerto RicanPuget Sound SalishRomanianRussianSalvadoranSamoanScandinavianScotch-IrishScottishSeminoleSenegaleseSerbianShoshoneSierra LeoneanSiouxSlavicSlovakSloveneSomaliSouth AfricanSouth AmericanSouth American IndianSoviet UnionSpaniardSpanishSpanish AmericanSpanish American IndianSri LankanSubsaharan AfricanSudaneseSwedishSwissSyrianTaiwaneseThaiTlingit-HaidaTohono O'OdhamTonganTrinidadian and TobagonianTsimshianTurkishU.S. Virgin IslanderUgandanUkrainianUruguayanUteVenezuelanVietnameseWelshWest IndianYakamaYaquiYugoslavianYumanYup'ikZimbabwean
Immigration
NonimmigrantsImmigrantsAfghanistanAfricaAlbaniaArgentinaArmeniaAsiaAustraliaAustriaBahamasBangladeshBarbadosBelarusBelgiumBelizeBoliviaBosnia and HerzegovinaBrazilBulgariaBurma/MyanmarCabo VerdeCambodiaCameroonCanadaCaribbeanCentral AmericaChileChinaColombiaCongoCosta RicaCroatiaCubaCzechoslovakiaDenmarkDominicaDominican RepublicEastern AfricaEastern AsiaEastern EuropeEcuadorEgyptEl SalvadorEnglandEritreaEthiopiaEuropeFijiFranceGermanyGhanaGreeceGrenadaGuatemalaGuyanaHaitiHondurasHong KongHungaryIndiaIndonesiaIranIraqIrelandIsraelItalyJamaicaJapanJordanKazakhstanKenyaKoreaKuwaitLaosLatin AmericaLatviaLebanonLiberiaLithuaniaMalaysiaMexicoMicronesiaMiddle AfricaMoldovaMoroccoNepalNetherlandsNicaraguaNigeriaNorth AmericaNorth MacedoniaNorthern AfricaNorthern EuropeNorwayOceaniaPakistanPanamaPeruPhilippinesPolandPortugalRomaniaRussiaSaudi ArabiaScotlandSenegalSerbiaSierra LeoneSingaporeSomaliaSouth AfricaSouth AmericaSouth Central AsiaSouth Eastern AsiaSouthern EuropeSpainSri LankaSt. Vincent and the GrenadinesSudanSwedenSwitzerlandSyriaTaiwanThailandTrinidad and TobagoTurkeyUgandaUkraineUruguayUzbekistanVenezuelaVietnamWest IndiesWestern AfricaWestern AsiaWestern EuropeYemenZaireZimbabweAzores
Unemployment
Income
Poverty
Unemployment
Labor Participation
Family Structure
Vehicle Availability
Education Level
Disability

Unemployment Comparison

Austrians

Immigrants from South Africa

Exceptional
Exceptional
4.8%
UNEMPLOYMENT
99.5/ 100
METRIC RATING
44th/ 347
METRIC RANK
5.0%
UNEMPLOYMENT
96.2/ 100
METRIC RATING
92nd/ 347
METRIC RANK

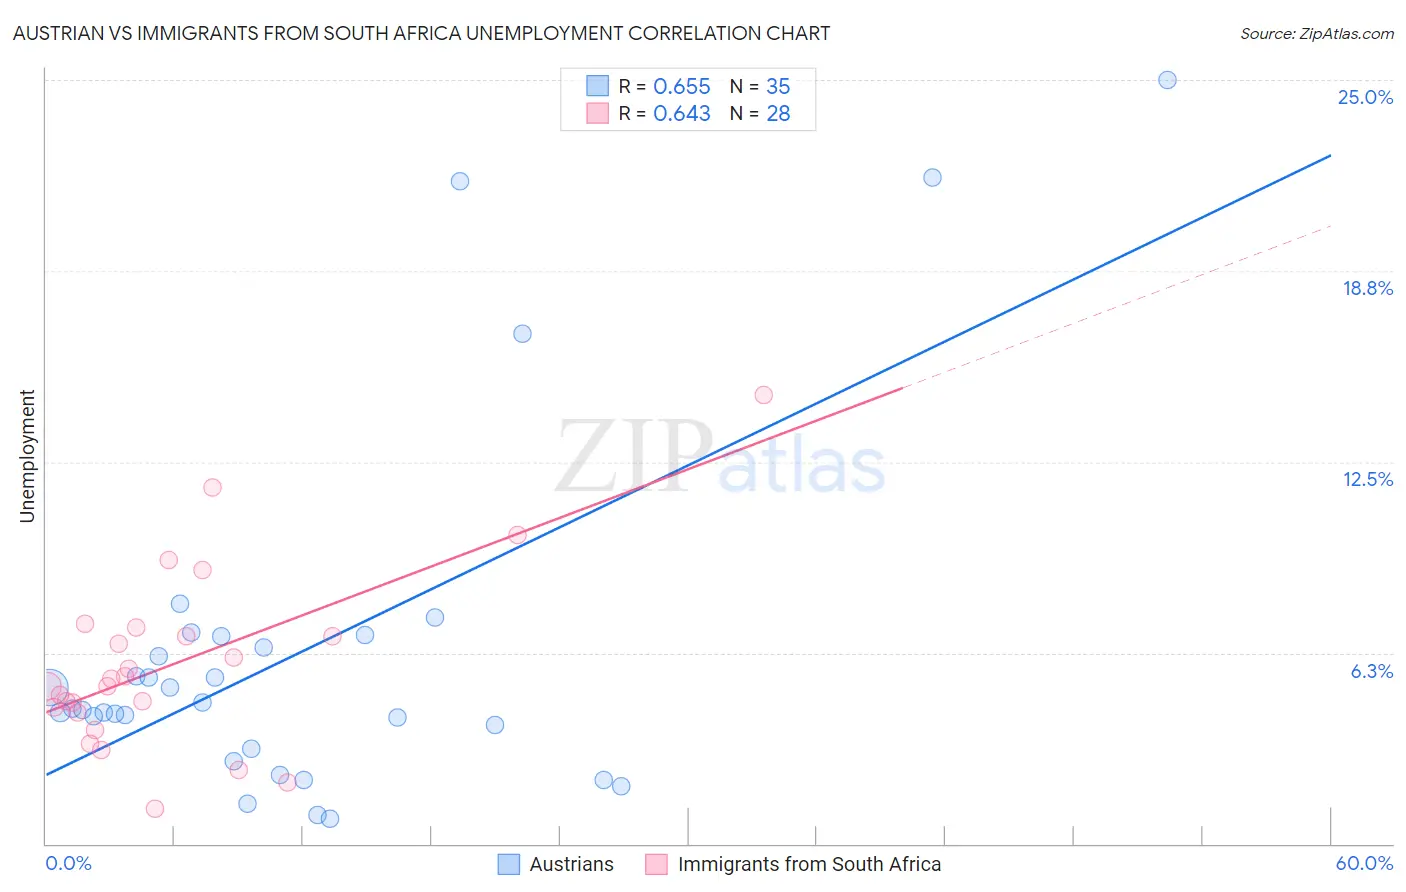
Austrian vs Immigrants from South Africa Unemployment Correlation Chart

The statistical analysis conducted on geographies consisting of 451,169,494 people shows a significant positive correlation between the proportion of Austrians and unemployment in the United States with a correlation coefficient (R) of 0.655 and weighted average of 4.8%. Similarly, the statistical analysis conducted on geographies consisting of 233,181,435 people shows a significant positive correlation between the proportion of Immigrants from South Africa and unemployment in the United States with a correlation coefficient (R) of 0.643 and weighted average of 5.0%, a difference of 3.3%.
Austrian vs Immigrants from South Africa Unemployment

Unemployment Correlation Summary

MeasurementAustrianImmigrants from South Africa
Minimum0.80%1.2%
Maximum25.0%14.7%
Range24.2%13.5%
Mean6.3%5.9%
Median4.4%5.3%
Interquartile 25% (IQ1)3.1%4.4%
Interquartile 75% (IQ3)6.8%6.9%
Interquartile Range (IQR)3.7%2.5%
Standard Deviation (Sample)5.9%3.0%
Standard Deviation (Population)5.8%2.9%

Similar Demographics by Unemployment

Demographics Similar to Austrians by Unemployment

In terms of unemployment, the demographic groups most similar to Austrians are French (4.8%, a difference of 0.050%), Yugoslavian (4.8%, a difference of 0.060%), Immigrants from Nepal (4.8%, a difference of 0.22%), Immigrants from Taiwan (4.8%, a difference of 0.24%), and Filipino (4.8%, a difference of 0.26%).
DemographicsRating | RankUnemployment
Czechoslovakians
99.7
/100
|
#37
Exceptional
4.8%
Bolivians
99.7
/100
|
#38
Exceptional
4.8%
Lithuanians
99.7
/100
|
#39
Exceptional
4.8%
Northern Europeans
99.7
/100
|
#40
Exceptional
4.8%
Immigrants | Bosnia and Herzegovina
99.7
/100
|
#41
Exceptional
4.8%
Filipinos
99.5
/100
|
#42
Exceptional
4.8%
Yugoslavians
99.5
/100
|
#43
Exceptional
4.8%
Austrians
99.5
/100
|
#44
Exceptional
4.8%
French
99.5
/100
|
#45
Exceptional
4.8%
Immigrants | Nepal
99.4
/100
|
#46
Exceptional
4.8%
Immigrants | Taiwan
99.4
/100
|
#47
Exceptional
4.8%
Immigrants | Scotland
99.3
/100
|
#48
Exceptional
4.9%
Immigrants | South Central Asia
99.3
/100
|
#49
Exceptional
4.9%
French Canadians
99.3
/100
|
#50
Exceptional
4.9%
Immigrants | Belgium
99.2
/100
|
#51
Exceptional
4.9%

Demographics Similar to Immigrants from South Africa by Unemployment

In terms of unemployment, the demographic groups most similar to Immigrants from South Africa are Immigrants from Sudan (5.0%, a difference of 0.020%), Immigrants from North Macedonia (5.0%, a difference of 0.030%), Jordanian (5.0%, a difference of 0.070%), Ukrainian (5.0%, a difference of 0.090%), and Immigrants from Austria (5.0%, a difference of 0.12%).
DemographicsRating | RankUnemployment
Immigrants | Australia
97.0
/100
|
#85
Exceptional
5.0%
Hungarians
96.9
/100
|
#86
Exceptional
5.0%
Immigrants | Moldova
96.6
/100
|
#87
Exceptional
5.0%
Immigrants | Korea
96.6
/100
|
#88
Exceptional
5.0%
Jordanians
96.4
/100
|
#89
Exceptional
5.0%
Immigrants | North Macedonia
96.3
/100
|
#90
Exceptional
5.0%
Immigrants | Sudan
96.3
/100
|
#91
Exceptional
5.0%
Immigrants | South Africa
96.2
/100
|
#92
Exceptional
5.0%
Ukrainians
96.0
/100
|
#93
Exceptional
5.0%
Immigrants | Austria
95.9
/100
|
#94
Exceptional
5.0%
Immigrants | Serbia
95.6
/100
|
#95
Exceptional
5.0%
Immigrants | England
95.2
/100
|
#96
Exceptional
5.0%
Immigrants | Czechoslovakia
95.1
/100
|
#97
Exceptional
5.0%
Romanians
95.0
/100
|
#98
Exceptional
5.0%
Mongolians
94.8
/100
|
#99
Exceptional
5.0%