Austrian vs Immigrants from Eastern Africa Unemployment Among Youth under 25 years
COMPARE
Austrian
Immigrants from Eastern Africa
Unemployment Among Youth under 25 years
Unemployment Among Youth under 25 years Comparison
Austrians
Immigrants from Eastern Africa
11.2%
UNEMPLOYMENT AMONG YOUTH UNDER 25 YEARS
95.5/ 100
METRIC RATING
88th/ 347
METRIC RANK
11.1%
UNEMPLOYMENT AMONG YOUTH UNDER 25 YEARS
98.7/ 100
METRIC RATING
59th/ 347
METRIC RANK
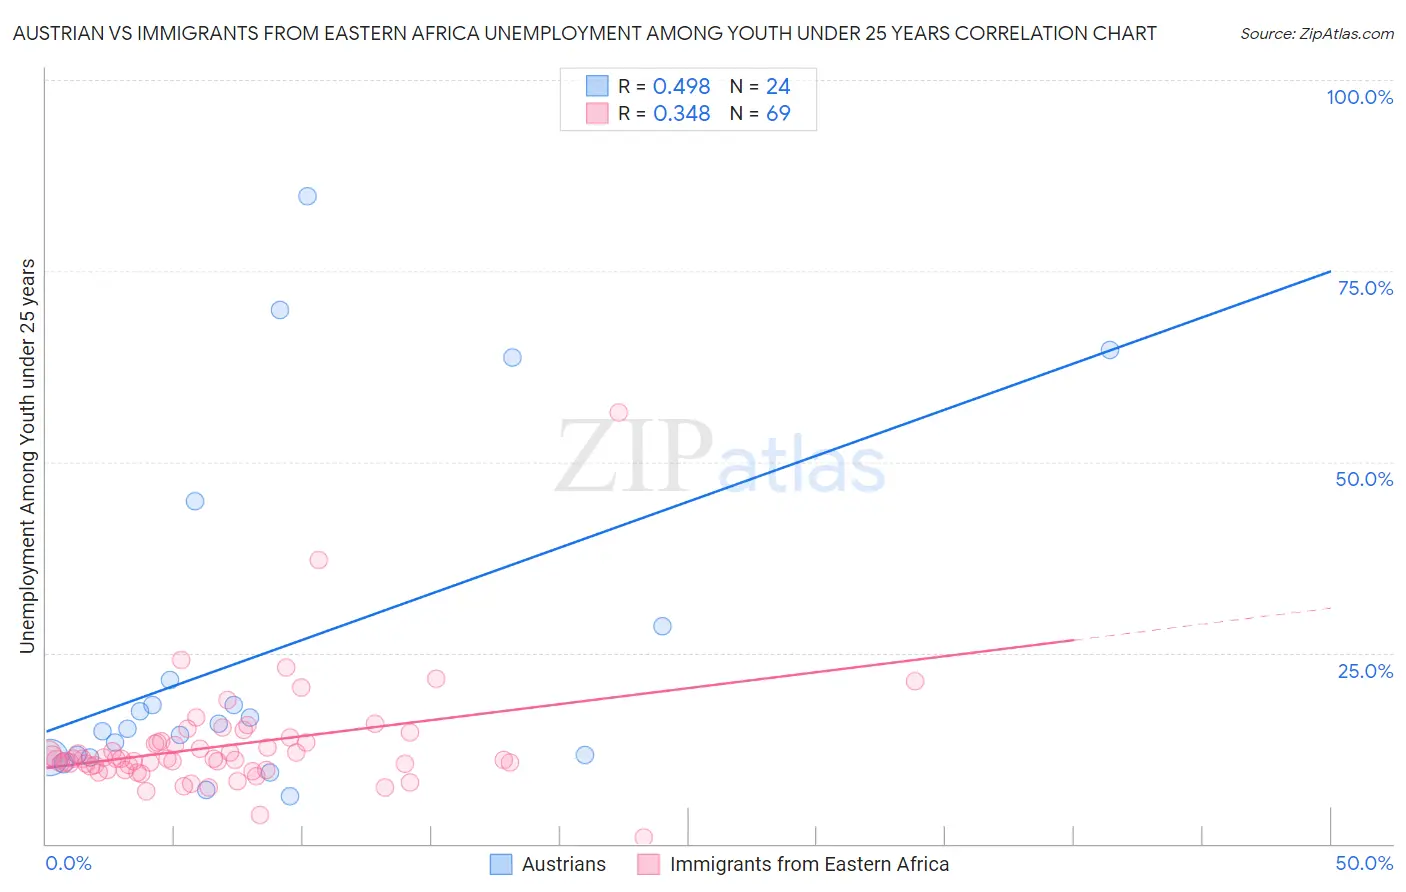
Austrian vs Immigrants from Eastern Africa Unemployment Among Youth under 25 years Correlation Chart
The statistical analysis conducted on geographies consisting of 442,500,644 people shows a moderate positive correlation between the proportion of Austrians and unemployment rate among youth under the age of 25 in the United States with a correlation coefficient (R) of 0.498 and weighted average of 11.2%. Similarly, the statistical analysis conducted on geographies consisting of 352,305,050 people shows a mild positive correlation between the proportion of Immigrants from Eastern Africa and unemployment rate among youth under the age of 25 in the United States with a correlation coefficient (R) of 0.348 and weighted average of 11.1%, a difference of 1.4%.
Unemployment Among Youth under 25 years Correlation Summary
| Measurement | Austrian | Immigrants from Eastern Africa |
| Minimum | 6.2% | 0.80% |
| Maximum | 84.7% | 56.4% |
| Range | 78.5% | 55.6% |
| Mean | 25.0% | 12.9% |
| Median | 15.4% | 11.1% |
| Interquartile 25% (IQ1) | 11.5% | 9.9% |
| Interquartile 75% (IQ3) | 25.0% | 13.3% |
| Interquartile Range (IQR) | 13.5% | 3.4% |
| Standard Deviation (Sample) | 22.5% | 7.3% |
| Standard Deviation (Population) | 22.1% | 7.2% |
Similar Demographics by Unemployment Among Youth under 25 years
Demographics Similar to Austrians by Unemployment Among Youth under 25 years
In terms of unemployment among youth under 25 years, the demographic groups most similar to Austrians are Immigrants from Japan (11.2%, a difference of 0.0%), Immigrants from Bolivia (11.2%, a difference of 0.010%), Kenyan (11.2%, a difference of 0.050%), Immigrants from South Africa (11.2%, a difference of 0.070%), and Immigrants from South Central Asia (11.2%, a difference of 0.090%).
| Demographics | Rating | Rank | Unemployment Among Youth under 25 years |
| Icelanders | 96.3 /100 | #81 | Exceptional 11.2% |
| Northern Europeans | 96.2 /100 | #82 | Exceptional 11.2% |
| Bolivians | 96.1 /100 | #83 | Exceptional 11.2% |
| French Canadians | 95.9 /100 | #84 | Exceptional 11.2% |
| Immigrants | South Central Asia | 95.9 /100 | #85 | Exceptional 11.2% |
| Immigrants | South Africa | 95.8 /100 | #86 | Exceptional 11.2% |
| Kenyans | 95.7 /100 | #87 | Exceptional 11.2% |
| Austrians | 95.5 /100 | #88 | Exceptional 11.2% |
| Immigrants | Japan | 95.5 /100 | #89 | Exceptional 11.2% |
| Immigrants | Bolivia | 95.5 /100 | #90 | Exceptional 11.2% |
| Immigrants | Taiwan | 95.1 /100 | #91 | Exceptional 11.2% |
| Immigrants | Latvia | 95.1 /100 | #92 | Exceptional 11.2% |
| Immigrants | North America | 95.1 /100 | #93 | Exceptional 11.2% |
| Lithuanians | 94.8 /100 | #94 | Exceptional 11.3% |
| Carpatho Rusyns | 94.4 /100 | #95 | Exceptional 11.3% |
Demographics Similar to Immigrants from Eastern Africa by Unemployment Among Youth under 25 years
In terms of unemployment among youth under 25 years, the demographic groups most similar to Immigrants from Eastern Africa are Scotch-Irish (11.1%, a difference of 0.060%), Immigrants from Eritrea (11.1%, a difference of 0.10%), Immigrants from Saudi Arabia (11.1%, a difference of 0.11%), Mongolian (11.1%, a difference of 0.13%), and Irish (11.1%, a difference of 0.13%).
| Demographics | Rating | Rank | Unemployment Among Youth under 25 years |
| Latvians | 99.0 /100 | #52 | Exceptional 11.0% |
| Ottawa | 99.0 /100 | #53 | Exceptional 11.1% |
| Mongolians | 98.9 /100 | #54 | Exceptional 11.1% |
| Irish | 98.9 /100 | #55 | Exceptional 11.1% |
| Immigrants | Saudi Arabia | 98.8 /100 | #56 | Exceptional 11.1% |
| Immigrants | Eritrea | 98.8 /100 | #57 | Exceptional 11.1% |
| Scotch-Irish | 98.8 /100 | #58 | Exceptional 11.1% |
| Immigrants | Eastern Africa | 98.7 /100 | #59 | Exceptional 11.1% |
| South Africans | 98.5 /100 | #60 | Exceptional 11.1% |
| Filipinos | 98.3 /100 | #61 | Exceptional 11.1% |
| Immigrants | Netherlands | 98.1 /100 | #62 | Exceptional 11.1% |
| Immigrants | Croatia | 98.1 /100 | #63 | Exceptional 11.1% |
| Jordanians | 97.9 /100 | #64 | Exceptional 11.1% |
| Immigrants | Singapore | 97.8 /100 | #65 | Exceptional 11.2% |
| Macedonians | 97.7 /100 | #66 | Exceptional 11.2% |