Australian vs African Unemployment Among Ages 20 to 24 years
COMPARE
Australian
African
Unemployment Among Ages 20 to 24 years
Unemployment Among Ages 20 to 24 years Comparison
Australians
Africans
9.6%
UNEMPLOYMENT AMONG AGES 20 TO 24 YEARS
100.0/ 100
METRIC RATING
33rd/ 347
METRIC RANK
11.5%
UNEMPLOYMENT AMONG AGES 20 TO 24 YEARS
0.0/ 100
METRIC RATING
277th/ 347
METRIC RANK
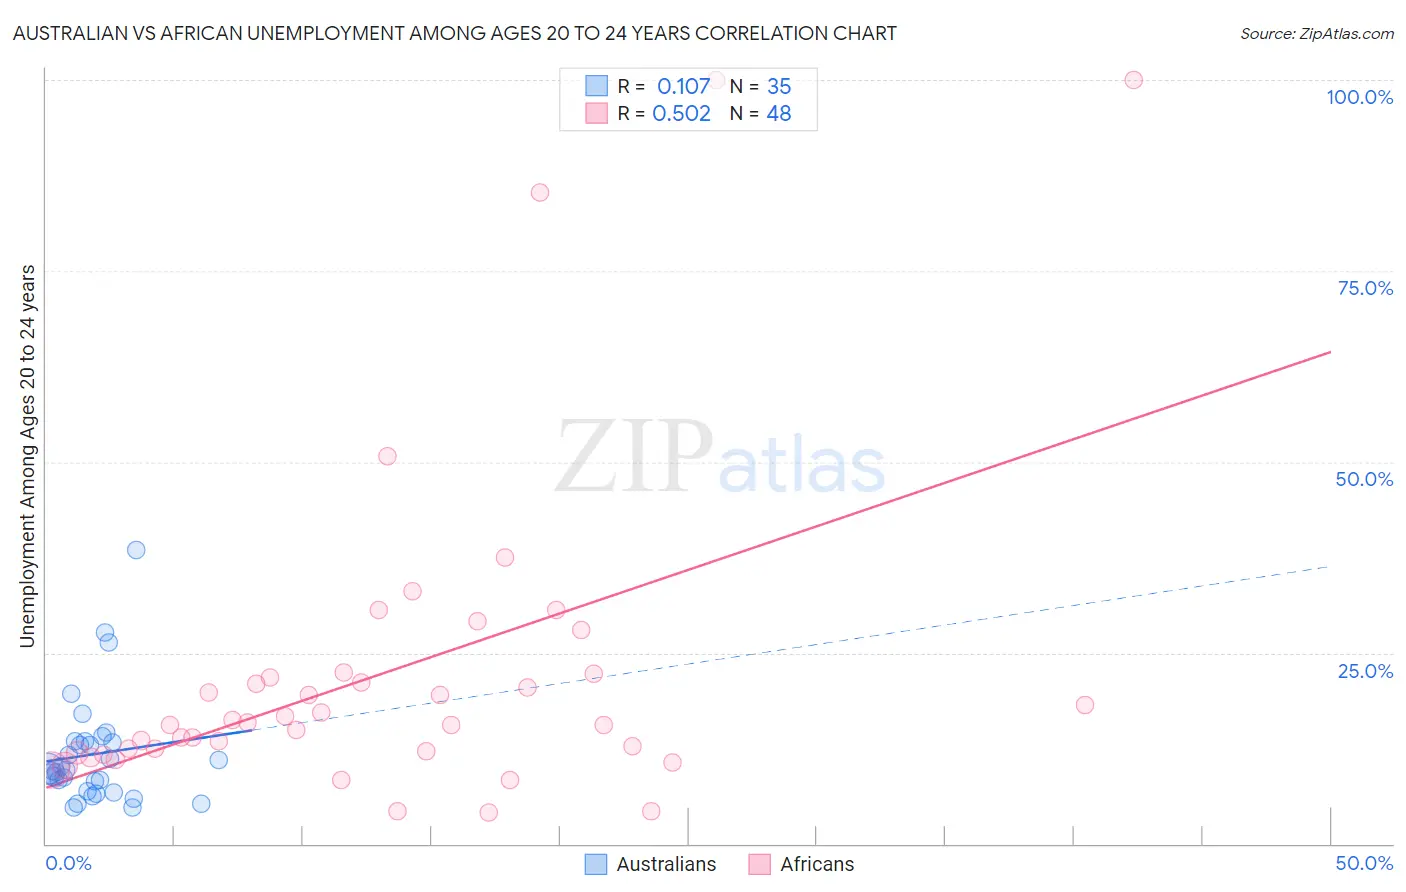
Australian vs African Unemployment Among Ages 20 to 24 years Correlation Chart
The statistical analysis conducted on geographies consisting of 219,577,245 people shows a poor positive correlation between the proportion of Australians and unemployment rate among population between the ages 20 and 24 in the United States with a correlation coefficient (R) of 0.107 and weighted average of 9.6%. Similarly, the statistical analysis conducted on geographies consisting of 452,548,100 people shows a substantial positive correlation between the proportion of Africans and unemployment rate among population between the ages 20 and 24 in the United States with a correlation coefficient (R) of 0.502 and weighted average of 11.5%, a difference of 20.9%.
Unemployment Among Ages 20 to 24 years Correlation Summary
| Measurement | Australian | African |
| Minimum | 4.7% | 4.0% |
| Maximum | 38.5% | 100.0% |
| Range | 33.8% | 96.0% |
| Mean | 11.7% | 22.3% |
| Median | 9.6% | 15.7% |
| Interquartile 25% (IQ1) | 6.9% | 12.0% |
| Interquartile 75% (IQ3) | 13.4% | 22.0% |
| Interquartile Range (IQR) | 6.5% | 10.0% |
| Standard Deviation (Sample) | 7.1% | 21.0% |
| Standard Deviation (Population) | 7.0% | 20.8% |
Similar Demographics by Unemployment Among Ages 20 to 24 years
Demographics Similar to Australians by Unemployment Among Ages 20 to 24 years
In terms of unemployment among ages 20 to 24 years, the demographic groups most similar to Australians are Cambodian (9.5%, a difference of 0.11%), Immigrants from Eastern Africa (9.5%, a difference of 0.16%), Yugoslavian (9.6%, a difference of 0.20%), Scandinavian (9.5%, a difference of 0.24%), and Immigrants from North Macedonia (9.5%, a difference of 0.26%).
| Demographics | Rating | Rank | Unemployment Among Ages 20 to 24 years |
| Swedes | 100.0 /100 | #26 | Exceptional 9.5% |
| Immigrants | Zimbabwe | 100.0 /100 | #27 | Exceptional 9.5% |
| Immigrants | Afghanistan | 100.0 /100 | #28 | Exceptional 9.5% |
| Immigrants | North Macedonia | 100.0 /100 | #29 | Exceptional 9.5% |
| Scandinavians | 100.0 /100 | #30 | Exceptional 9.5% |
| Immigrants | Eastern Africa | 100.0 /100 | #31 | Exceptional 9.5% |
| Cambodians | 100.0 /100 | #32 | Exceptional 9.5% |
| Australians | 100.0 /100 | #33 | Exceptional 9.6% |
| Yugoslavians | 100.0 /100 | #34 | Exceptional 9.6% |
| Germans | 100.0 /100 | #35 | Exceptional 9.6% |
| Belgians | 100.0 /100 | #36 | Exceptional 9.6% |
| Immigrants | Zaire | 100.0 /100 | #37 | Exceptional 9.6% |
| Afghans | 99.9 /100 | #38 | Exceptional 9.6% |
| Dutch | 99.9 /100 | #39 | Exceptional 9.6% |
| Immigrants | Ethiopia | 99.9 /100 | #40 | Exceptional 9.6% |
Demographics Similar to Africans by Unemployment Among Ages 20 to 24 years
In terms of unemployment among ages 20 to 24 years, the demographic groups most similar to Africans are Colville (11.6%, a difference of 0.030%), Sierra Leonean (11.5%, a difference of 0.15%), Senegalese (11.5%, a difference of 0.19%), Bahamian (11.6%, a difference of 0.28%), and Cape Verdean (11.5%, a difference of 0.54%).
| Demographics | Rating | Rank | Unemployment Among Ages 20 to 24 years |
| Delaware | 0.0 /100 | #270 | Tragic 11.3% |
| Immigrants | Uzbekistan | 0.0 /100 | #271 | Tragic 11.4% |
| Nigerians | 0.0 /100 | #272 | Tragic 11.4% |
| Immigrants | Nigeria | 0.0 /100 | #273 | Tragic 11.5% |
| Cape Verdeans | 0.0 /100 | #274 | Tragic 11.5% |
| Senegalese | 0.0 /100 | #275 | Tragic 11.5% |
| Sierra Leoneans | 0.0 /100 | #276 | Tragic 11.5% |
| Africans | 0.0 /100 | #277 | Tragic 11.5% |
| Colville | 0.0 /100 | #278 | Tragic 11.6% |
| Bahamians | 0.0 /100 | #279 | Tragic 11.6% |
| Alaskan Athabascans | 0.0 /100 | #280 | Tragic 11.6% |
| Armenians | 0.0 /100 | #281 | Tragic 11.7% |
| Immigrants | Cameroon | 0.0 /100 | #282 | Tragic 11.7% |
| Ghanaians | 0.0 /100 | #283 | Tragic 11.7% |
| Immigrants | Western Africa | 0.0 /100 | #284 | Tragic 11.7% |