Assyrian/Chaldean/Syriac vs Native/Alaskan Unemployment Among Ages 55 to 59 years
COMPARE
Assyrian/Chaldean/Syriac
Native/Alaskan
Unemployment Among Ages 55 to 59 years
Unemployment Among Ages 55 to 59 years Comparison
Assyrians/Chaldeans/Syriacs
Natives/Alaskans
4.5%
UNEMPLOYMENT AMONG AGES 55 TO 59 YEARS
99.9/ 100
METRIC RATING
38th/ 347
METRIC RANK
6.0%
UNEMPLOYMENT AMONG AGES 55 TO 59 YEARS
0.0/ 100
METRIC RATING
326th/ 347
METRIC RANK
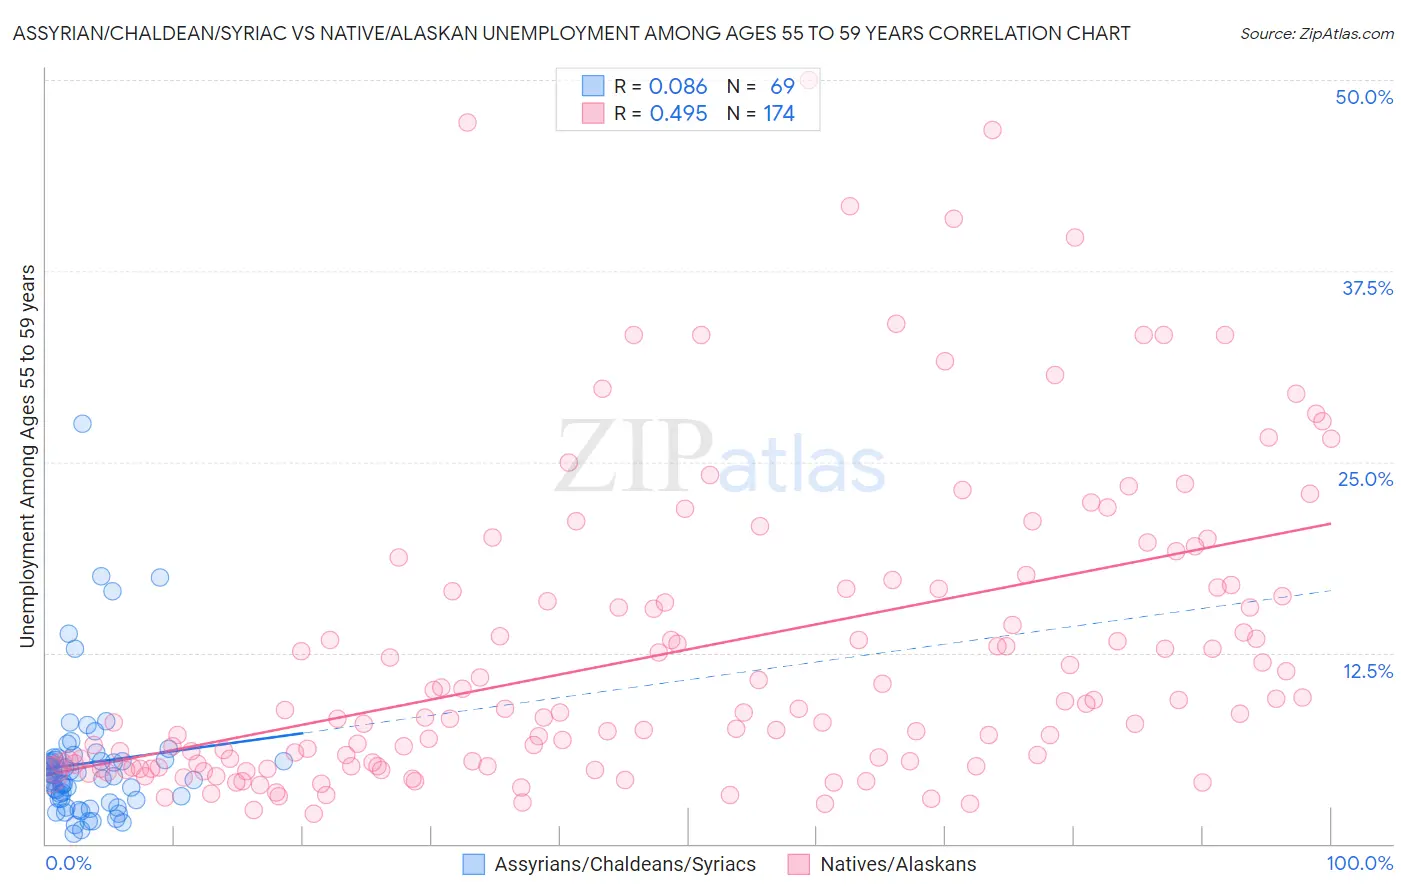
Assyrian/Chaldean/Syriac vs Native/Alaskan Unemployment Among Ages 55 to 59 years Correlation Chart
The statistical analysis conducted on geographies consisting of 108,497,216 people shows a slight positive correlation between the proportion of Assyrians/Chaldeans/Syriacs and unemployment rate among population between the ages 55 and 59 in the United States with a correlation coefficient (R) of 0.086 and weighted average of 4.5%. Similarly, the statistical analysis conducted on geographies consisting of 455,461,585 people shows a moderate positive correlation between the proportion of Natives/Alaskans and unemployment rate among population between the ages 55 and 59 in the United States with a correlation coefficient (R) of 0.495 and weighted average of 6.0%, a difference of 33.8%.
Unemployment Among Ages 55 to 59 years Correlation Summary
| Measurement | Assyrian/Chaldean/Syriac | Native/Alaskan |
| Minimum | 0.69% | 2.0% |
| Maximum | 27.5% | 50.0% |
| Range | 26.8% | 48.0% |
| Mean | 5.3% | 12.5% |
| Median | 4.5% | 8.5% |
| Interquartile 25% (IQ1) | 2.9% | 5.1% |
| Interquartile 75% (IQ3) | 5.6% | 16.7% |
| Interquartile Range (IQR) | 2.6% | 11.6% |
| Standard Deviation (Sample) | 4.4% | 10.1% |
| Standard Deviation (Population) | 4.4% | 10.0% |
Similar Demographics by Unemployment Among Ages 55 to 59 years
Demographics Similar to Assyrians/Chaldeans/Syriacs by Unemployment Among Ages 55 to 59 years
In terms of unemployment among ages 55 to 59 years, the demographic groups most similar to Assyrians/Chaldeans/Syriacs are Ethiopian (4.5%, a difference of 0.18%), Immigrants from Bulgaria (4.5%, a difference of 0.18%), English (4.5%, a difference of 0.26%), Cypriot (4.5%, a difference of 0.27%), and Thai (4.5%, a difference of 0.29%).
| Demographics | Rating | Rank | Unemployment Among Ages 55 to 59 years |
| Germans | 99.9 /100 | #31 | Exceptional 4.5% |
| Immigrants | Ethiopia | 99.9 /100 | #32 | Exceptional 4.5% |
| Belgians | 99.9 /100 | #33 | Exceptional 4.5% |
| Thais | 99.9 /100 | #34 | Exceptional 4.5% |
| Cypriots | 99.9 /100 | #35 | Exceptional 4.5% |
| Ethiopians | 99.9 /100 | #36 | Exceptional 4.5% |
| Immigrants | Bulgaria | 99.9 /100 | #37 | Exceptional 4.5% |
| Assyrians/Chaldeans/Syriacs | 99.9 /100 | #38 | Exceptional 4.5% |
| English | 99.9 /100 | #39 | Exceptional 4.5% |
| Swiss | 99.8 /100 | #40 | Exceptional 4.5% |
| Luxembourgers | 99.8 /100 | #41 | Exceptional 4.5% |
| Immigrants | Kuwait | 99.8 /100 | #42 | Exceptional 4.5% |
| Immigrants | Korea | 99.8 /100 | #43 | Exceptional 4.5% |
| Europeans | 99.8 /100 | #44 | Exceptional 4.5% |
| British | 99.8 /100 | #45 | Exceptional 4.5% |
Demographics Similar to Natives/Alaskans by Unemployment Among Ages 55 to 59 years
In terms of unemployment among ages 55 to 59 years, the demographic groups most similar to Natives/Alaskans are Immigrants from Armenia (6.0%, a difference of 0.37%), Arapaho (6.1%, a difference of 0.88%), Yuman (6.1%, a difference of 2.1%), Vietnamese (5.9%, a difference of 2.1%), and Crow (5.9%, a difference of 2.2%).
| Demographics | Rating | Rank | Unemployment Among Ages 55 to 59 years |
| Kiowa | 0.0 /100 | #319 | Tragic 5.8% |
| Immigrants | Azores | 0.0 /100 | #320 | Tragic 5.8% |
| Chippewa | 0.0 /100 | #321 | Tragic 5.9% |
| Crow | 0.0 /100 | #322 | Tragic 5.9% |
| Immigrants | Bangladesh | 0.0 /100 | #323 | Tragic 5.9% |
| Vietnamese | 0.0 /100 | #324 | Tragic 5.9% |
| Immigrants | Armenia | 0.0 /100 | #325 | Tragic 6.0% |
| Natives/Alaskans | 0.0 /100 | #326 | Tragic 6.0% |
| Arapaho | 0.0 /100 | #327 | Tragic 6.1% |
| Yuman | 0.0 /100 | #328 | Tragic 6.1% |
| Dominicans | 0.0 /100 | #329 | Tragic 6.2% |
| Alaska Natives | 0.0 /100 | #330 | Tragic 6.2% |
| Immigrants | Dominican Republic | 0.0 /100 | #331 | Tragic 6.3% |
| Aleuts | 0.0 /100 | #332 | Tragic 6.4% |
| Pima | 0.0 /100 | #333 | Tragic 6.6% |