Assyrian/Chaldean/Syriac vs Iraqi Unemployment Among Ages 45 to 54 years
COMPARE
Assyrian/Chaldean/Syriac
Iraqi
Unemployment Among Ages 45 to 54 years
Unemployment Among Ages 45 to 54 years Comparison
Assyrians/Chaldeans/Syriacs
Iraqis
4.7%
UNEMPLOYMENT AMONG AGES 45 TO 54 YEARS
3.5/ 100
METRIC RATING
226th/ 347
METRIC RANK
4.7%
UNEMPLOYMENT AMONG AGES 45 TO 54 YEARS
3.2/ 100
METRIC RATING
227th/ 347
METRIC RANK
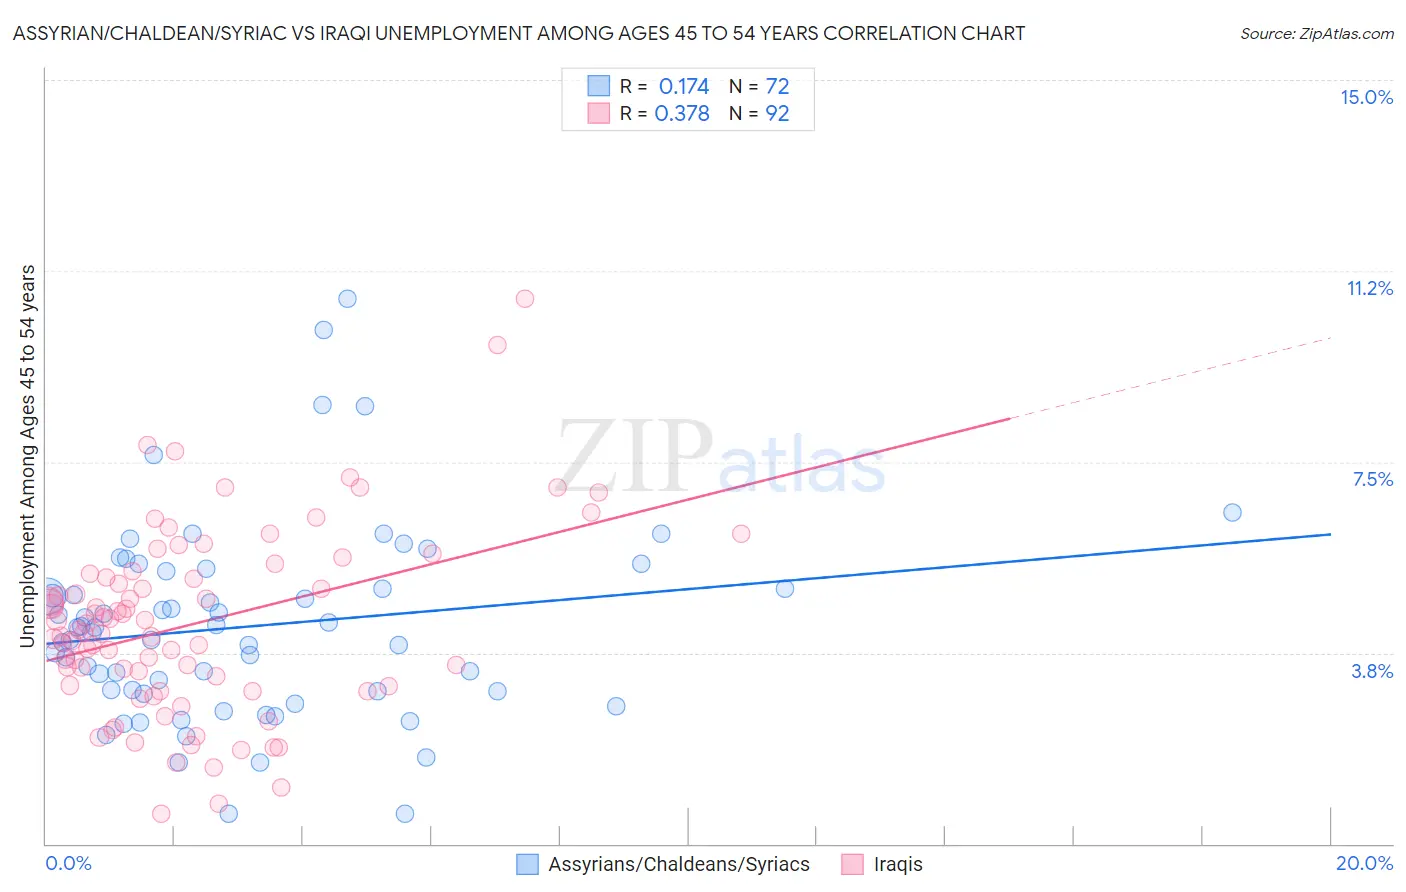
Assyrian/Chaldean/Syriac vs Iraqi Unemployment Among Ages 45 to 54 years Correlation Chart
The statistical analysis conducted on geographies consisting of 109,531,563 people shows a poor positive correlation between the proportion of Assyrians/Chaldeans/Syriacs and unemployment rate among population between the ages 45 and 54 in the United States with a correlation coefficient (R) of 0.174 and weighted average of 4.7%. Similarly, the statistical analysis conducted on geographies consisting of 169,145,598 people shows a mild positive correlation between the proportion of Iraqis and unemployment rate among population between the ages 45 and 54 in the United States with a correlation coefficient (R) of 0.378 and weighted average of 4.7%, a difference of 0.090%.
Unemployment Among Ages 45 to 54 years Correlation Summary
| Measurement | Assyrian/Chaldean/Syriac | Iraqi |
| Minimum | 0.60% | 0.60% |
| Maximum | 10.7% | 10.7% |
| Range | 10.1% | 10.1% |
| Mean | 4.3% | 4.3% |
| Median | 4.2% | 4.2% |
| Interquartile 25% (IQ1) | 3.0% | 3.1% |
| Interquartile 75% (IQ3) | 5.2% | 5.3% |
| Interquartile Range (IQR) | 2.2% | 2.2% |
| Standard Deviation (Sample) | 1.9% | 1.8% |
| Standard Deviation (Population) | 1.9% | 1.8% |
Demographics Similar to Assyrians/Chaldeans/Syriacs and Iraqis by Unemployment Among Ages 45 to 54 years
In terms of unemployment among ages 45 to 54 years, the demographic groups most similar to Assyrians/Chaldeans/Syriacs are South American Indian (4.7%, a difference of 0.12%), Immigrants from Israel (4.7%, a difference of 0.17%), Japanese (4.7%, a difference of 0.25%), Immigrants from Ireland (4.7%, a difference of 0.29%), and Ottawa (4.7%, a difference of 0.29%). Similarly, the demographic groups most similar to Iraqis are South American Indian (4.7%, a difference of 0.030%), Immigrants from Israel (4.7%, a difference of 0.080%), Japanese (4.7%, a difference of 0.16%), Immigrants from Ireland (4.7%, a difference of 0.19%), and Ottawa (4.7%, a difference of 0.20%).
| Demographics | Rating | Rank | Unemployment Among Ages 45 to 54 years |
| Lumbee | 9.2 /100 | #216 | Tragic 4.6% |
| Immigrants | Cambodia | 7.4 /100 | #217 | Tragic 4.7% |
| Immigrants | Uganda | 7.1 /100 | #218 | Tragic 4.7% |
| Nigerians | 7.0 /100 | #219 | Tragic 4.7% |
| Guamanians/Chamorros | 6.8 /100 | #220 | Tragic 4.7% |
| Choctaw | 6.1 /100 | #221 | Tragic 4.7% |
| Immigrants | Southern Europe | 6.0 /100 | #222 | Tragic 4.7% |
| Potawatomi | 5.7 /100 | #223 | Tragic 4.7% |
| Comanche | 4.8 /100 | #224 | Tragic 4.7% |
| Immigrants | Norway | 4.8 /100 | #225 | Tragic 4.7% |
| Assyrians/Chaldeans/Syriacs | 3.5 /100 | #226 | Tragic 4.7% |
| Iraqis | 3.2 /100 | #227 | Tragic 4.7% |
| South American Indians | 3.1 /100 | #228 | Tragic 4.7% |
| Immigrants | Israel | 3.0 /100 | #229 | Tragic 4.7% |
| Japanese | 2.8 /100 | #230 | Tragic 4.7% |
| Immigrants | Ireland | 2.7 /100 | #231 | Tragic 4.7% |
| Ottawa | 2.7 /100 | #232 | Tragic 4.7% |
| Immigrants | Immigrants | 2.6 /100 | #233 | Tragic 4.7% |
| Soviet Union | 2.6 /100 | #234 | Tragic 4.7% |
| Cree | 2.3 /100 | #235 | Tragic 4.7% |
| Tlingit-Haida | 2.3 /100 | #236 | Tragic 4.7% |