Asian vs Immigrants from Guatemala Unemployment Among Seniors over 75 years
COMPARE
Asian
Immigrants from Guatemala
Unemployment Among Seniors over 75 years
Unemployment Among Seniors over 75 years Comparison
Asians
Immigrants from Guatemala
8.3%
UNEMPLOYMENT AMONG SENIORS OVER 75 YEARS
98.5/ 100
METRIC RATING
113th/ 347
METRIC RANK
8.7%
UNEMPLOYMENT AMONG SENIORS OVER 75 YEARS
68.4/ 100
METRIC RATING
163rd/ 347
METRIC RANK
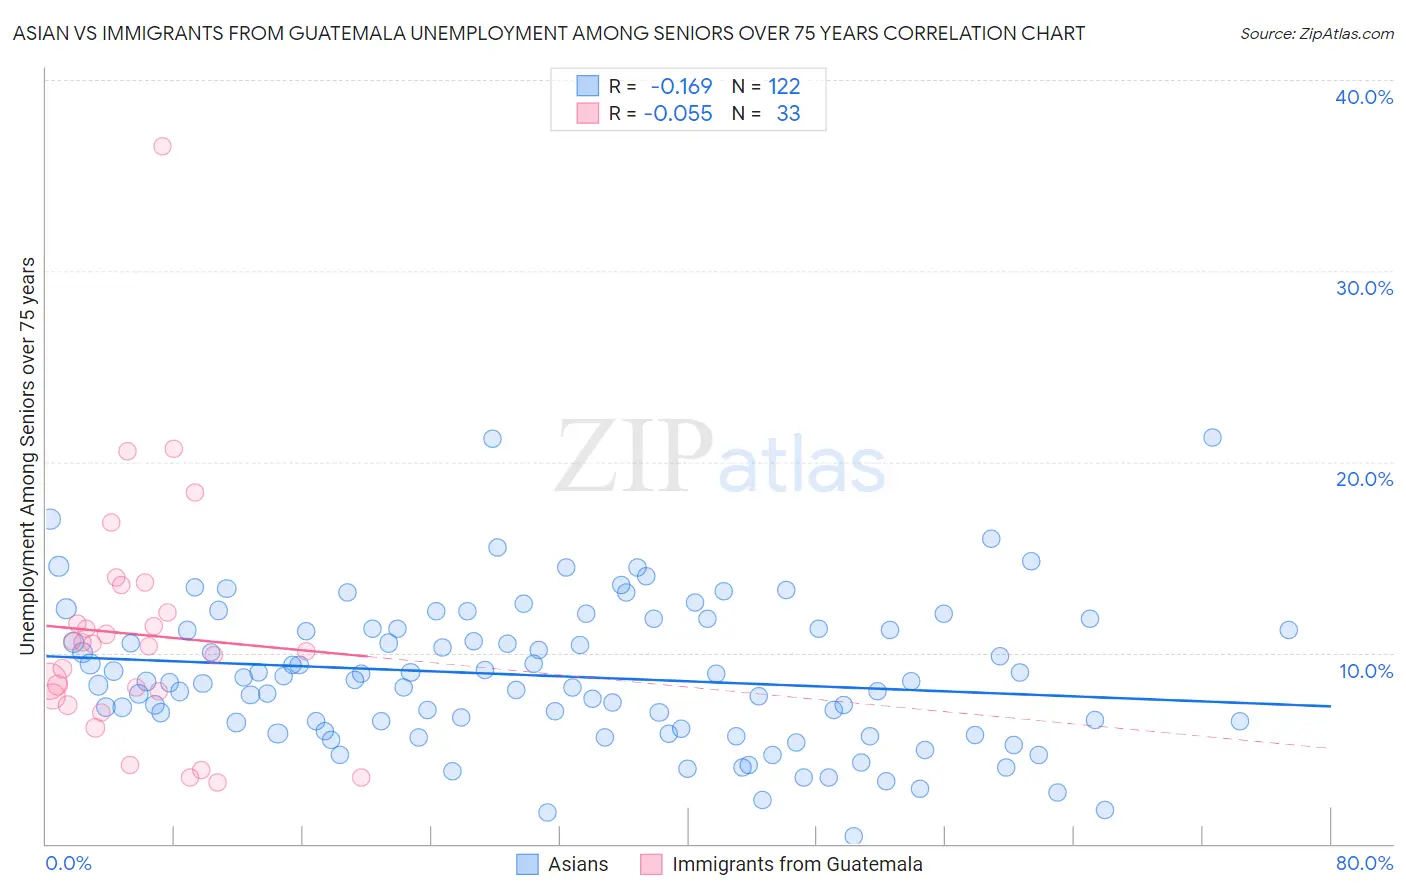
Asian vs Immigrants from Guatemala Unemployment Among Seniors over 75 years Correlation Chart
The statistical analysis conducted on geographies consisting of 233,630,058 people shows a poor negative correlation between the proportion of Asians and unemployment rate among seniors over the age of 75 in the United States with a correlation coefficient (R) of -0.169 and weighted average of 8.3%. Similarly, the statistical analysis conducted on geographies consisting of 194,202,123 people shows a slight negative correlation between the proportion of Immigrants from Guatemala and unemployment rate among seniors over the age of 75 in the United States with a correlation coefficient (R) of -0.055 and weighted average of 8.7%, a difference of 4.9%.
Unemployment Among Seniors over 75 years Correlation Summary
| Measurement | Asian | Immigrants from Guatemala |
| Minimum | 0.40% | 3.2% |
| Maximum | 21.3% | 36.5% |
| Range | 20.9% | 33.3% |
| Mean | 8.8% | 11.0% |
| Median | 8.5% | 10.4% |
| Interquartile 25% (IQ1) | 6.0% | 7.5% |
| Interquartile 75% (IQ3) | 11.2% | 12.9% |
| Interquartile Range (IQR) | 5.2% | 5.4% |
| Standard Deviation (Sample) | 3.8% | 6.4% |
| Standard Deviation (Population) | 3.8% | 6.3% |
Similar Demographics by Unemployment Among Seniors over 75 years
Demographics Similar to Asians by Unemployment Among Seniors over 75 years
In terms of unemployment among seniors over 75 years, the demographic groups most similar to Asians are Immigrants from India (8.2%, a difference of 0.060%), Trinidadian and Tobagonian (8.3%, a difference of 0.15%), French American Indian (8.2%, a difference of 0.18%), Marshallese (8.2%, a difference of 0.23%), and Immigrants from Lebanon (8.2%, a difference of 0.26%).
| Demographics | Rating | Rank | Unemployment Among Seniors over 75 years |
| Immigrants | Honduras | 99.0 /100 | #106 | Exceptional 8.2% |
| Sri Lankans | 98.9 /100 | #107 | Exceptional 8.2% |
| Laotians | 98.8 /100 | #108 | Exceptional 8.2% |
| Immigrants | Lebanon | 98.8 /100 | #109 | Exceptional 8.2% |
| Marshallese | 98.7 /100 | #110 | Exceptional 8.2% |
| French American Indians | 98.7 /100 | #111 | Exceptional 8.2% |
| Immigrants | India | 98.6 /100 | #112 | Exceptional 8.2% |
| Asians | 98.5 /100 | #113 | Exceptional 8.3% |
| Trinidadians and Tobagonians | 98.4 /100 | #114 | Exceptional 8.3% |
| Sudanese | 98.2 /100 | #115 | Exceptional 8.3% |
| Immigrants | West Indies | 98.1 /100 | #116 | Exceptional 8.3% |
| Immigrants | Greece | 97.9 /100 | #117 | Exceptional 8.3% |
| Immigrants | Middle Africa | 97.9 /100 | #118 | Exceptional 8.3% |
| Japanese | 97.5 /100 | #119 | Exceptional 8.3% |
| Immigrants | Asia | 97.4 /100 | #120 | Exceptional 8.3% |
Demographics Similar to Immigrants from Guatemala by Unemployment Among Seniors over 75 years
In terms of unemployment among seniors over 75 years, the demographic groups most similar to Immigrants from Guatemala are Immigrants from South America (8.6%, a difference of 0.19%), Cree (8.6%, a difference of 0.29%), Albanian (8.6%, a difference of 0.29%), Paraguayan (8.7%, a difference of 0.37%), and Shoshone (8.6%, a difference of 0.41%).
| Demographics | Rating | Rank | Unemployment Among Seniors over 75 years |
| Immigrants | Bahamas | 76.5 /100 | #156 | Good 8.6% |
| Turks | 76.4 /100 | #157 | Good 8.6% |
| Ethiopians | 75.3 /100 | #158 | Good 8.6% |
| Shoshone | 74.6 /100 | #159 | Good 8.6% |
| Cree | 72.8 /100 | #160 | Good 8.6% |
| Albanians | 72.8 /100 | #161 | Good 8.6% |
| Immigrants | South America | 71.3 /100 | #162 | Good 8.6% |
| Immigrants | Guatemala | 68.4 /100 | #163 | Good 8.7% |
| Paraguayans | 62.2 /100 | #164 | Good 8.7% |
| Immigrants | Dominican Republic | 61.4 /100 | #165 | Good 8.7% |
| Immigrants | Belize | 57.6 /100 | #166 | Average 8.7% |
| Immigrants | Eastern Africa | 57.6 /100 | #167 | Average 8.7% |
| Immigrants | Lithuania | 57.2 /100 | #168 | Average 8.7% |
| Fijians | 56.4 /100 | #169 | Average 8.7% |
| Zimbabweans | 54.1 /100 | #170 | Average 8.7% |