Asian vs Apache Unemployment Among Women with Children Under 6 years
COMPARE
Asian
Apache
Unemployment Among Women with Children Under 6 years
Unemployment Among Women with Children Under 6 years Comparison
Asians
Apache
6.7%
UNEMPLOYMENT AMONG WOMEN WITH CHILDREN UNDER 6 YEARS
100.0/ 100
METRIC RATING
40th/ 347
METRIC RANK
12.3%
UNEMPLOYMENT AMONG WOMEN WITH CHILDREN UNDER 6 YEARS
0.0/ 100
METRIC RATING
334th/ 347
METRIC RANK
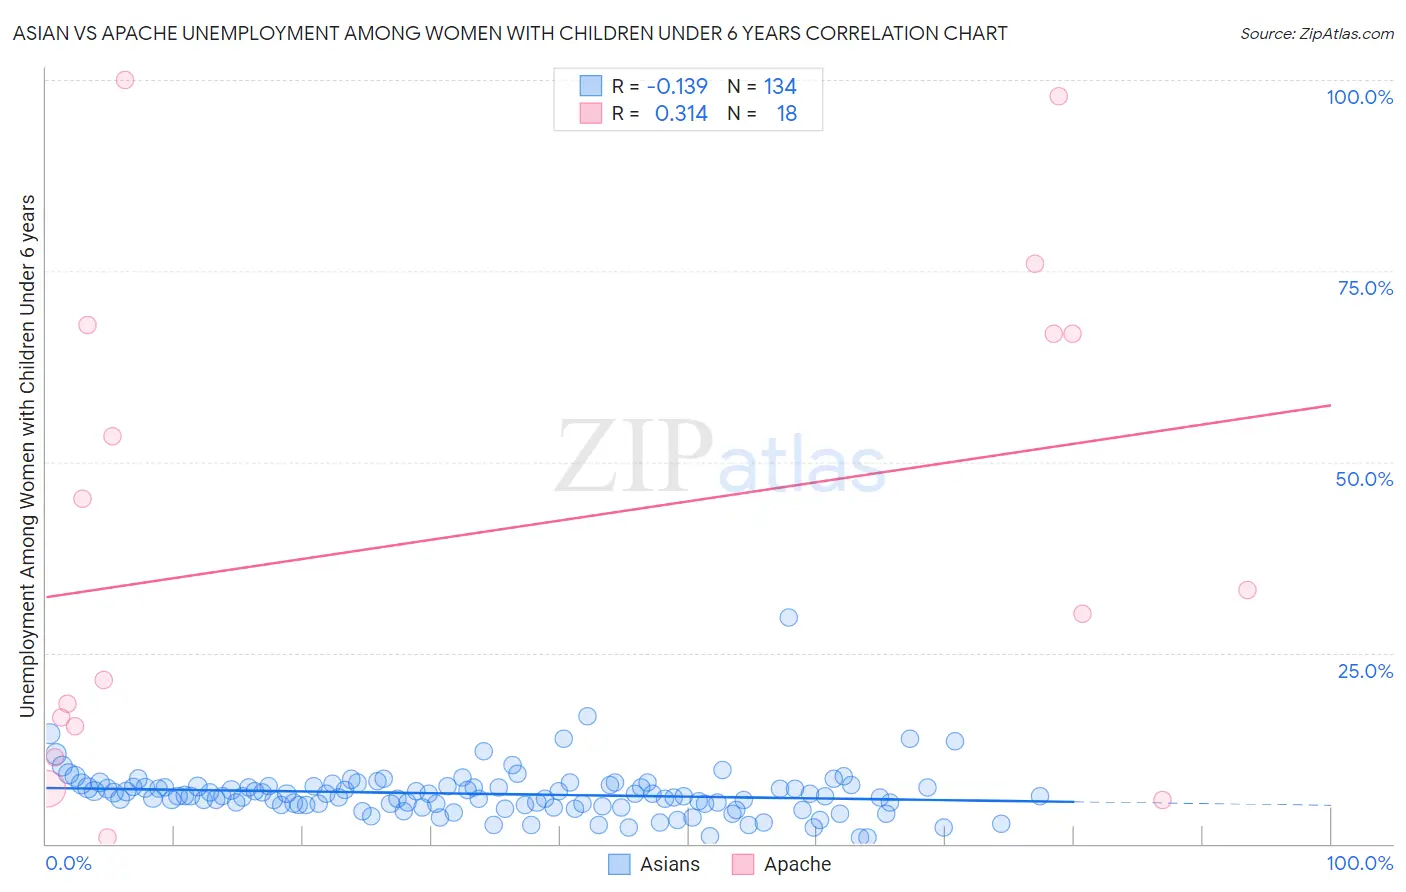
Asian vs Apache Unemployment Among Women with Children Under 6 years Correlation Chart
The statistical analysis conducted on geographies consisting of 374,627,418 people shows a poor negative correlation between the proportion of Asians and unemployment rate among women with children under the age of 6 in the United States with a correlation coefficient (R) of -0.139 and weighted average of 6.7%. Similarly, the statistical analysis conducted on geographies consisting of 192,370,998 people shows a mild positive correlation between the proportion of Apache and unemployment rate among women with children under the age of 6 in the United States with a correlation coefficient (R) of 0.314 and weighted average of 12.3%, a difference of 84.6%.
Unemployment Among Women with Children Under 6 years Correlation Summary
| Measurement | Asian | Apache |
| Minimum | 0.80% | 0.90% |
| Maximum | 29.6% | 100.0% |
| Range | 28.8% | 99.1% |
| Mean | 6.5% | 40.8% |
| Median | 6.3% | 31.7% |
| Interquartile 25% (IQ1) | 5.0% | 15.3% |
| Interquartile 75% (IQ3) | 7.5% | 66.7% |
| Interquartile Range (IQR) | 2.5% | 51.4% |
| Standard Deviation (Sample) | 3.3% | 31.9% |
| Standard Deviation (Population) | 3.3% | 31.0% |
Similar Demographics by Unemployment Among Women with Children Under 6 years
Demographics Similar to Asians by Unemployment Among Women with Children Under 6 years
In terms of unemployment among women with children under 6 years, the demographic groups most similar to Asians are Immigrants from Indonesia (6.7%, a difference of 0.16%), Immigrants from Russia (6.7%, a difference of 0.22%), Immigrants from Cuba (6.7%, a difference of 0.26%), Hmong (6.7%, a difference of 0.28%), and Sri Lankan (6.6%, a difference of 0.41%).
| Demographics | Rating | Rank | Unemployment Among Women with Children Under 6 years |
| Immigrants | Vietnam | 100.0 /100 | #33 | Exceptional 6.6% |
| Immigrants | South Central Asia | 100.0 /100 | #34 | Exceptional 6.6% |
| Yakama | 100.0 /100 | #35 | Exceptional 6.6% |
| Luxembourgers | 100.0 /100 | #36 | Exceptional 6.6% |
| Sri Lankans | 100.0 /100 | #37 | Exceptional 6.6% |
| Hmong | 100.0 /100 | #38 | Exceptional 6.7% |
| Immigrants | Russia | 100.0 /100 | #39 | Exceptional 6.7% |
| Asians | 100.0 /100 | #40 | Exceptional 6.7% |
| Immigrants | Indonesia | 99.9 /100 | #41 | Exceptional 6.7% |
| Immigrants | Cuba | 99.9 /100 | #42 | Exceptional 6.7% |
| Bhutanese | 99.9 /100 | #43 | Exceptional 6.7% |
| Iranians | 99.9 /100 | #44 | Exceptional 6.7% |
| Immigrants | Australia | 99.9 /100 | #45 | Exceptional 6.8% |
| Latvians | 99.9 /100 | #46 | Exceptional 6.8% |
| Immigrants | Asia | 99.9 /100 | #47 | Exceptional 6.8% |
Demographics Similar to Apache by Unemployment Among Women with Children Under 6 years
In terms of unemployment among women with children under 6 years, the demographic groups most similar to Apache are Puerto Rican (12.5%, a difference of 1.8%), Native/Alaskan (11.5%, a difference of 6.9%), Shoshone (13.2%, a difference of 7.0%), Sioux (11.5%, a difference of 7.5%), and Chippewa (13.3%, a difference of 8.2%).
| Demographics | Rating | Rank | Unemployment Among Women with Children Under 6 years |
| Ottawa | 0.0 /100 | #327 | Tragic 9.9% |
| Tohono O'odham | 0.0 /100 | #328 | Tragic 10.2% |
| Blacks/African Americans | 0.0 /100 | #329 | Tragic 10.3% |
| Pennsylvania Germans | 0.0 /100 | #330 | Tragic 10.8% |
| Colville | 0.0 /100 | #331 | Tragic 11.2% |
| Sioux | 0.0 /100 | #332 | Tragic 11.5% |
| Natives/Alaskans | 0.0 /100 | #333 | Tragic 11.5% |
| Apache | 0.0 /100 | #334 | Tragic 12.3% |
| Puerto Ricans | 0.0 /100 | #335 | Tragic 12.5% |
| Shoshone | 0.0 /100 | #336 | Tragic 13.2% |
| Chippewa | 0.0 /100 | #337 | Tragic 13.3% |
| Pima | 0.0 /100 | #338 | Tragic 13.4% |
| Navajo | 0.0 /100 | #339 | Tragic 13.5% |
| Immigrants | Yemen | 0.0 /100 | #340 | Tragic 13.5% |
| Lumbee | 0.0 /100 | #341 | Tragic 13.8% |