Armenian vs Immigrants from Sri Lanka Male Unemployment
COMPARE
Armenian
Immigrants from Sri Lanka
Male Unemployment
Male Unemployment Comparison
Armenians
Immigrants from Sri Lanka
6.0%
MALE UNEMPLOYMENT
0.0/ 100
METRIC RATING
273rd/ 347
METRIC RANK
5.1%
MALE UNEMPLOYMENT
94.9/ 100
METRIC RATING
88th/ 347
METRIC RANK
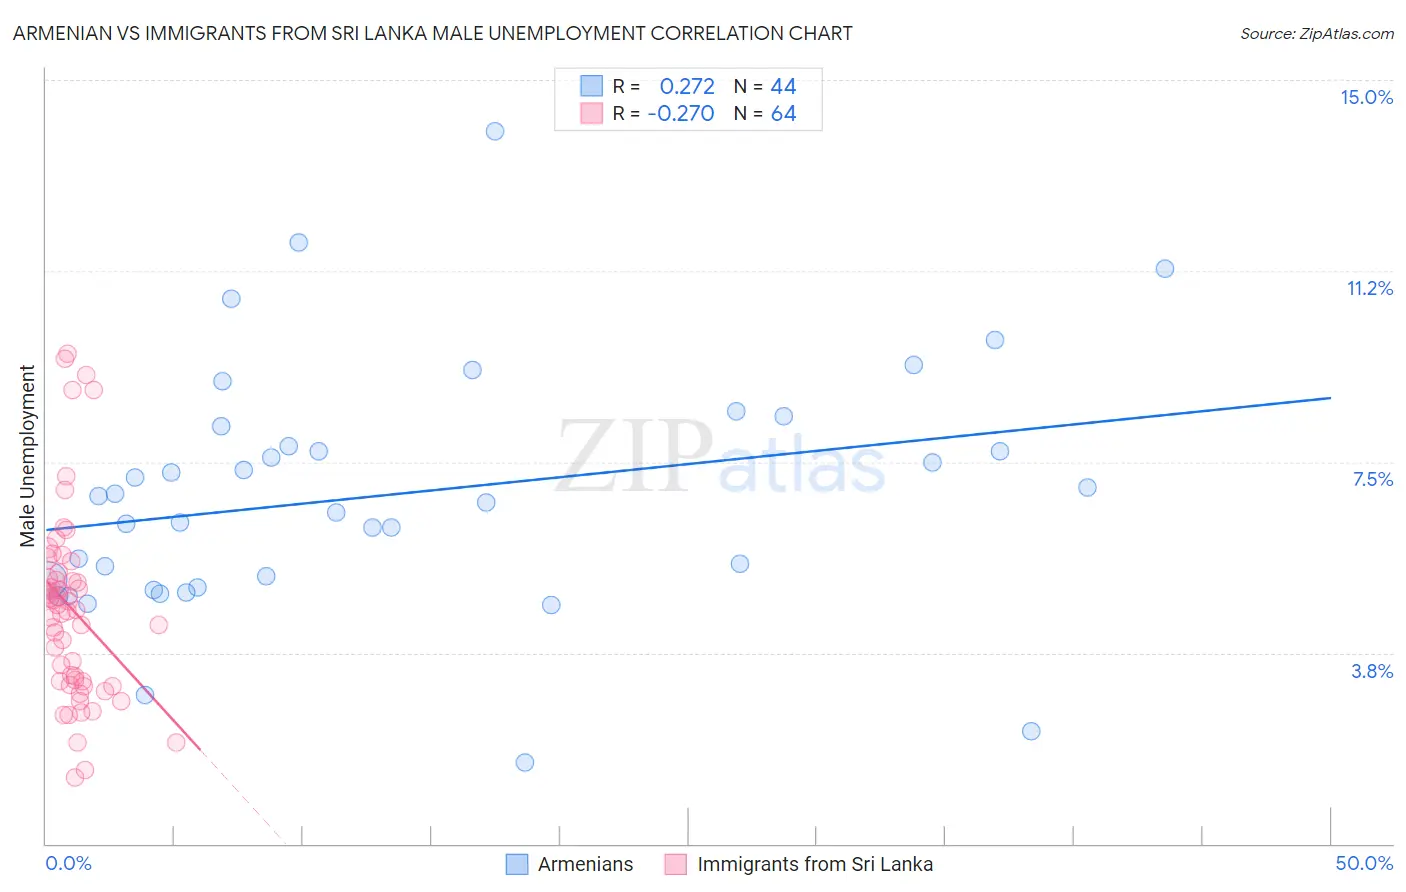
Armenian vs Immigrants from Sri Lanka Male Unemployment Correlation Chart
The statistical analysis conducted on geographies consisting of 310,068,401 people shows a weak positive correlation between the proportion of Armenians and unemployment rate among males in the United States with a correlation coefficient (R) of 0.272 and weighted average of 6.0%. Similarly, the statistical analysis conducted on geographies consisting of 149,610,733 people shows a weak negative correlation between the proportion of Immigrants from Sri Lanka and unemployment rate among males in the United States with a correlation coefficient (R) of -0.270 and weighted average of 5.1%, a difference of 18.4%.
Male Unemployment Correlation Summary
| Measurement | Armenian | Immigrants from Sri Lanka |
| Minimum | 1.6% | 1.3% |
| Maximum | 14.0% | 9.6% |
| Range | 12.4% | 8.3% |
| Mean | 6.9% | 4.6% |
| Median | 6.8% | 4.6% |
| Interquartile 25% (IQ1) | 5.1% | 3.2% |
| Interquartile 75% (IQ3) | 8.0% | 5.3% |
| Interquartile Range (IQR) | 2.9% | 2.1% |
| Standard Deviation (Sample) | 2.4% | 1.9% |
| Standard Deviation (Population) | 2.4% | 1.8% |
Similar Demographics by Male Unemployment
Demographics Similar to Armenians by Male Unemployment
In terms of male unemployment, the demographic groups most similar to Armenians are Immigrants from Uzbekistan (6.0%, a difference of 0.010%), Immigrants from Sierra Leone (6.0%, a difference of 0.17%), Blackfeet (6.0%, a difference of 0.24%), Menominee (6.0%, a difference of 0.33%), and Tlingit-Haida (6.0%, a difference of 0.43%).
| Demographics | Rating | Rank | Male Unemployment |
| Bahamians | 0.0 /100 | #266 | Tragic 5.9% |
| Nigerians | 0.0 /100 | #267 | Tragic 5.9% |
| Bermudans | 0.0 /100 | #268 | Tragic 5.9% |
| Immigrants | Nigeria | 0.0 /100 | #269 | Tragic 6.0% |
| Sub-Saharan Africans | 0.0 /100 | #270 | Tragic 6.0% |
| Blackfeet | 0.0 /100 | #271 | Tragic 6.0% |
| Immigrants | Uzbekistan | 0.0 /100 | #272 | Tragic 6.0% |
| Armenians | 0.0 /100 | #273 | Tragic 6.0% |
| Immigrants | Sierra Leone | 0.0 /100 | #274 | Tragic 6.0% |
| Menominee | 0.0 /100 | #275 | Tragic 6.0% |
| Tlingit-Haida | 0.0 /100 | #276 | Tragic 6.0% |
| Immigrants | Liberia | 0.0 /100 | #277 | Tragic 6.1% |
| Immigrants | Fiji | 0.0 /100 | #278 | Tragic 6.1% |
| Ghanaians | 0.0 /100 | #279 | Tragic 6.1% |
| Immigrants | Ghana | 0.0 /100 | #280 | Tragic 6.2% |
Demographics Similar to Immigrants from Sri Lanka by Male Unemployment
In terms of male unemployment, the demographic groups most similar to Immigrants from Sri Lanka are Immigrants from Australia (5.1%, a difference of 0.040%), Okinawan (5.1%, a difference of 0.040%), Immigrants from Turkey (5.1%, a difference of 0.13%), Slavic (5.1%, a difference of 0.18%), and Immigrants from Serbia (5.1%, a difference of 0.18%).
| Demographics | Rating | Rank | Male Unemployment |
| French | 96.2 /100 | #81 | Exceptional 5.0% |
| Chileans | 96.2 /100 | #82 | Exceptional 5.0% |
| Immigrants | Eritrea | 96.0 /100 | #83 | Exceptional 5.0% |
| Serbians | 95.7 /100 | #84 | Exceptional 5.1% |
| Immigrants | North Macedonia | 95.6 /100 | #85 | Exceptional 5.1% |
| Maltese | 95.5 /100 | #86 | Exceptional 5.1% |
| Immigrants | Romania | 95.4 /100 | #87 | Exceptional 5.1% |
| Immigrants | Sri Lanka | 94.9 /100 | #88 | Exceptional 5.1% |
| Immigrants | Australia | 94.7 /100 | #89 | Exceptional 5.1% |
| Okinawans | 94.7 /100 | #90 | Exceptional 5.1% |
| Immigrants | Turkey | 94.4 /100 | #91 | Exceptional 5.1% |
| Slavs | 94.2 /100 | #92 | Exceptional 5.1% |
| Immigrants | Serbia | 94.2 /100 | #93 | Exceptional 5.1% |
| Canadians | 94.1 /100 | #94 | Exceptional 5.1% |
| Italians | 93.8 /100 | #95 | Exceptional 5.1% |